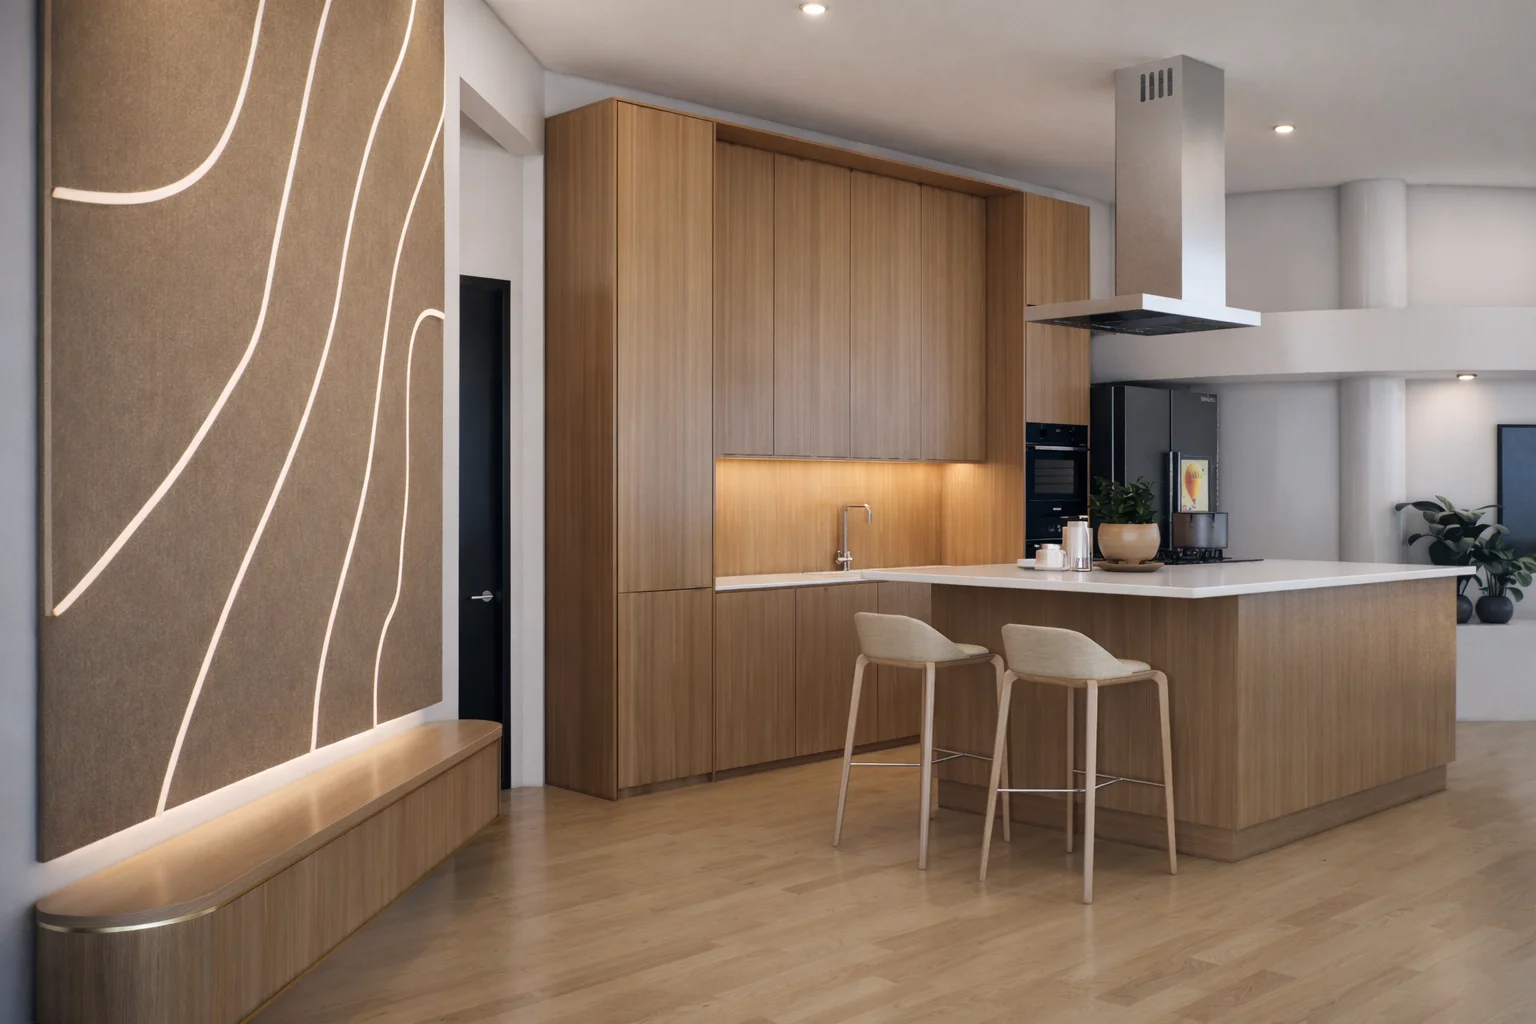
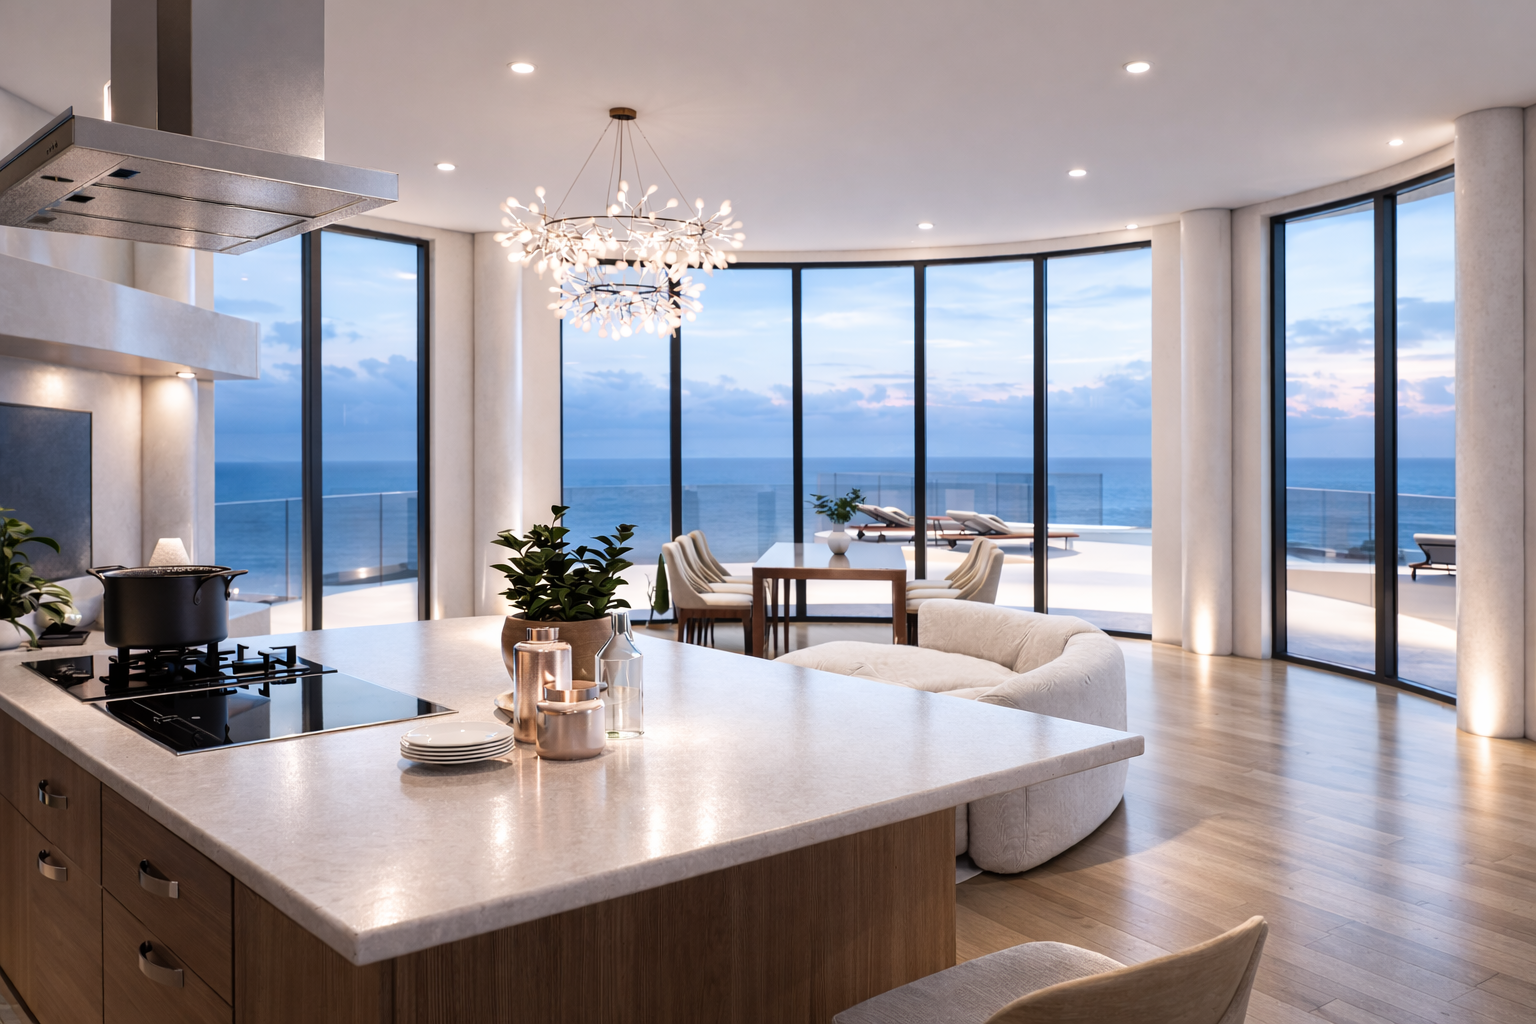
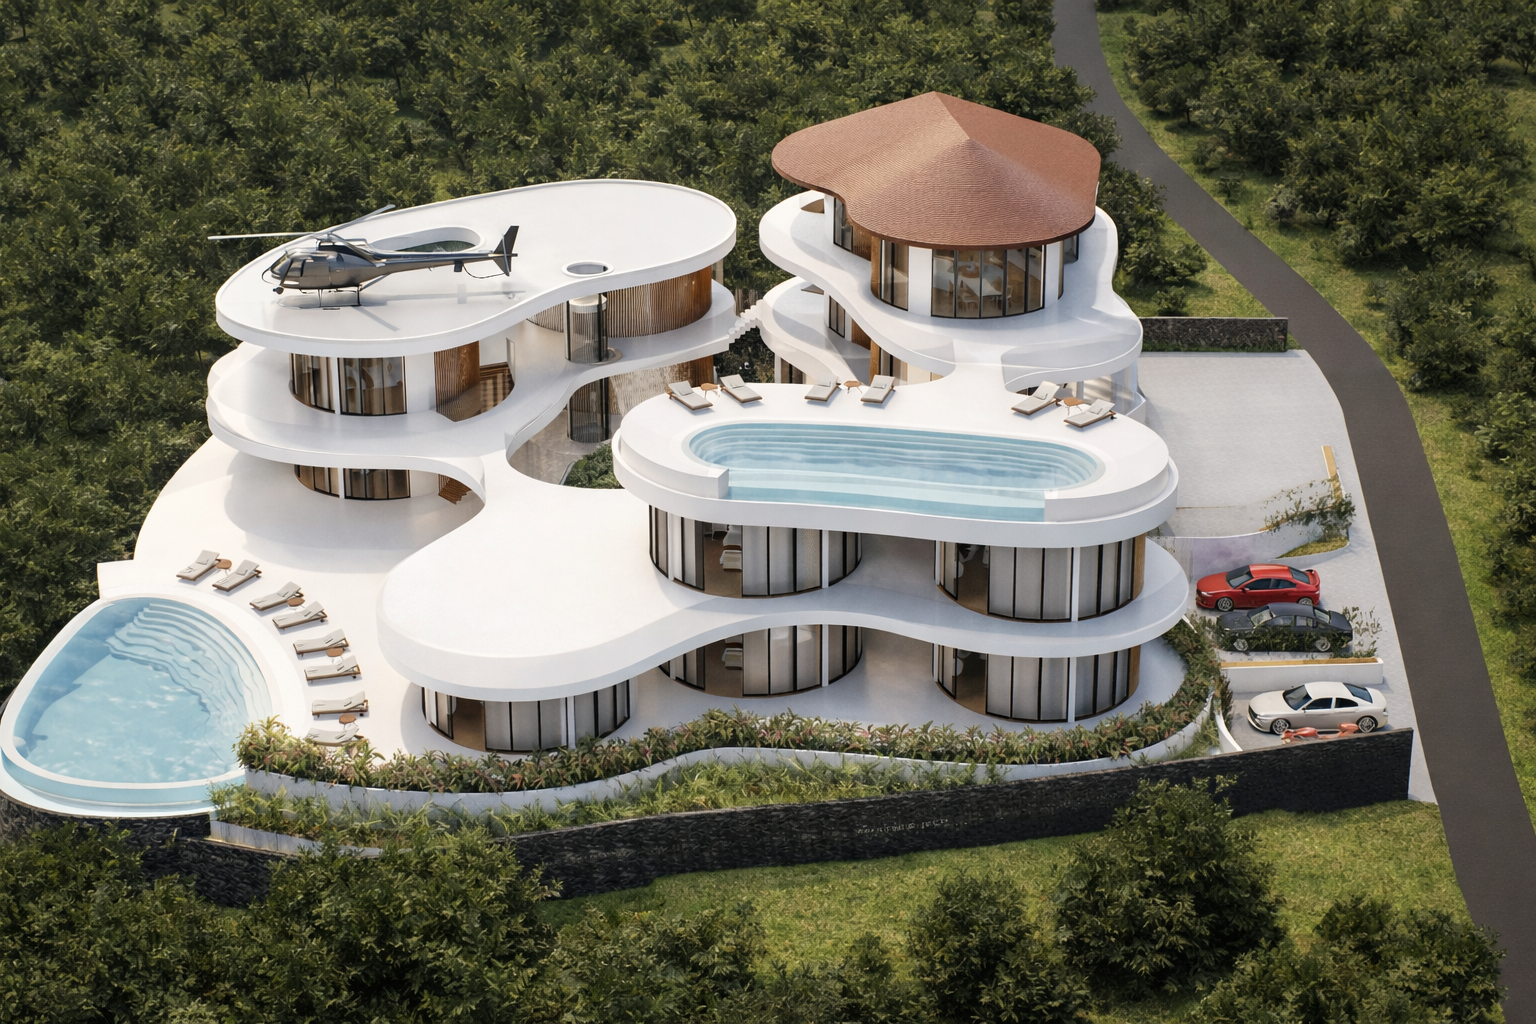
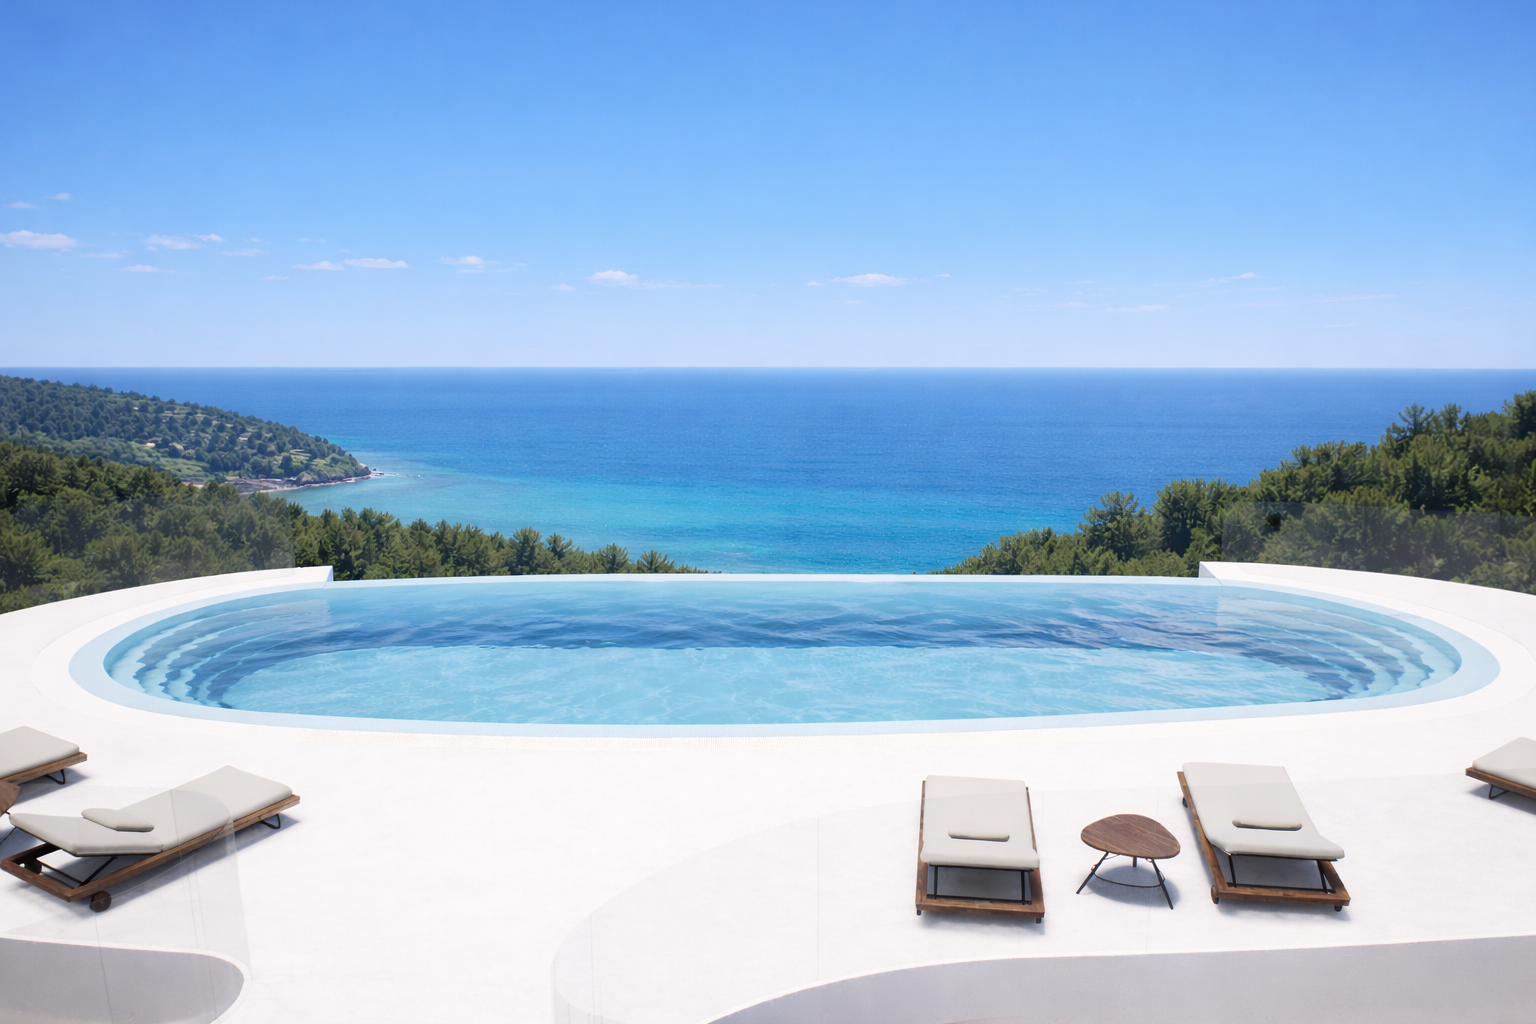
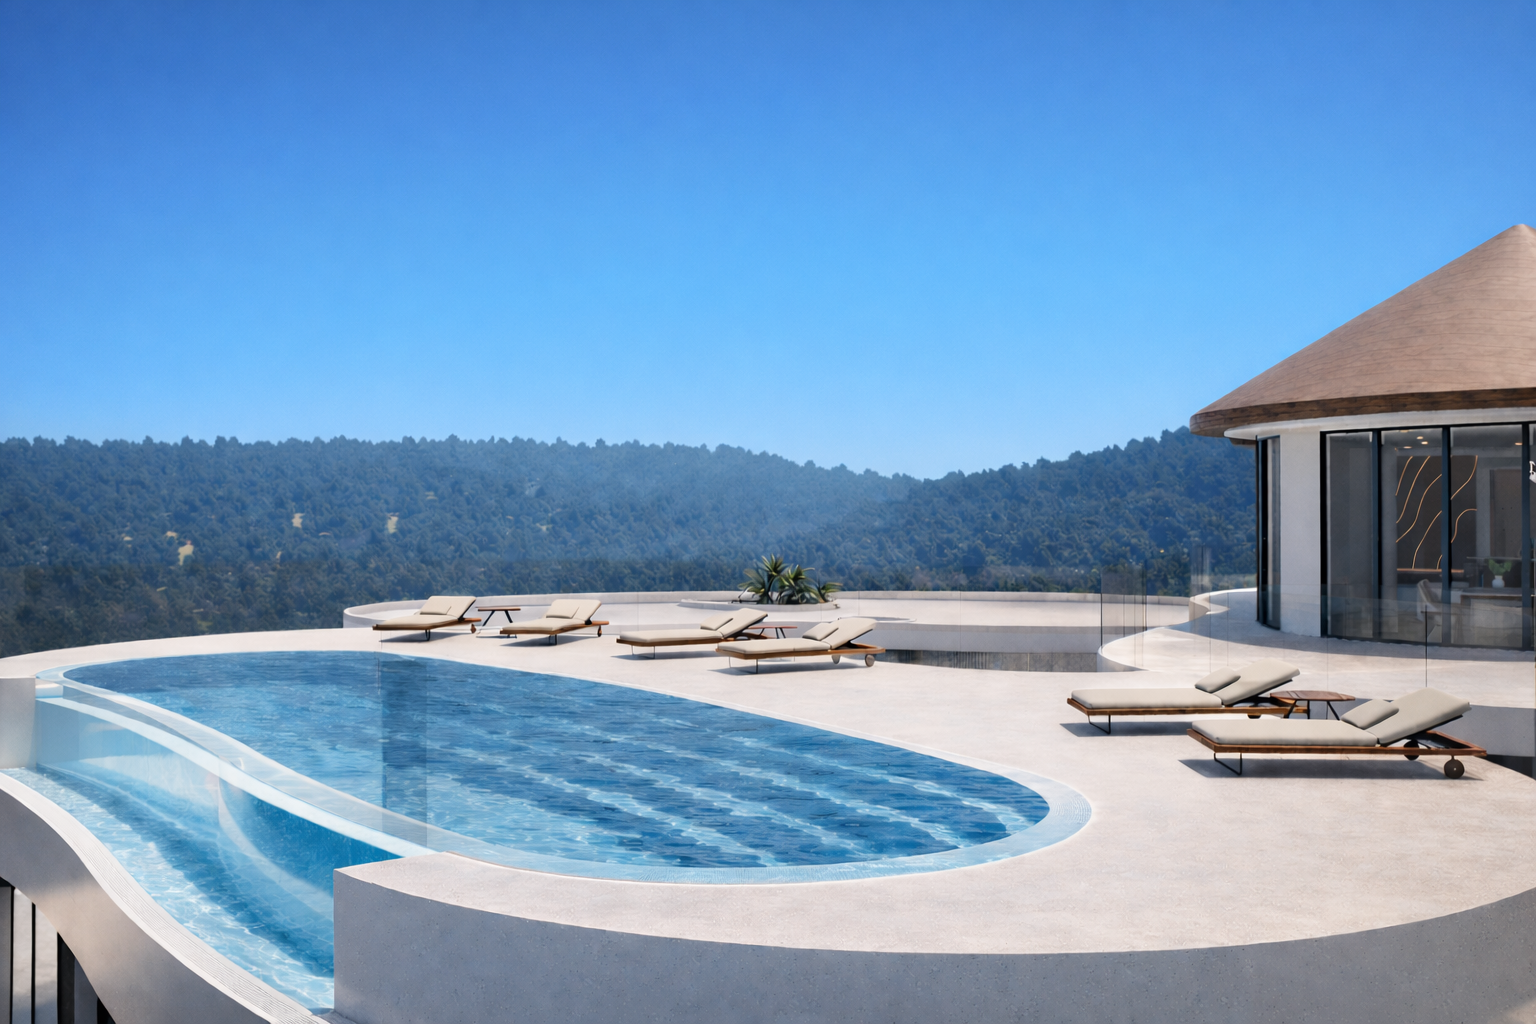
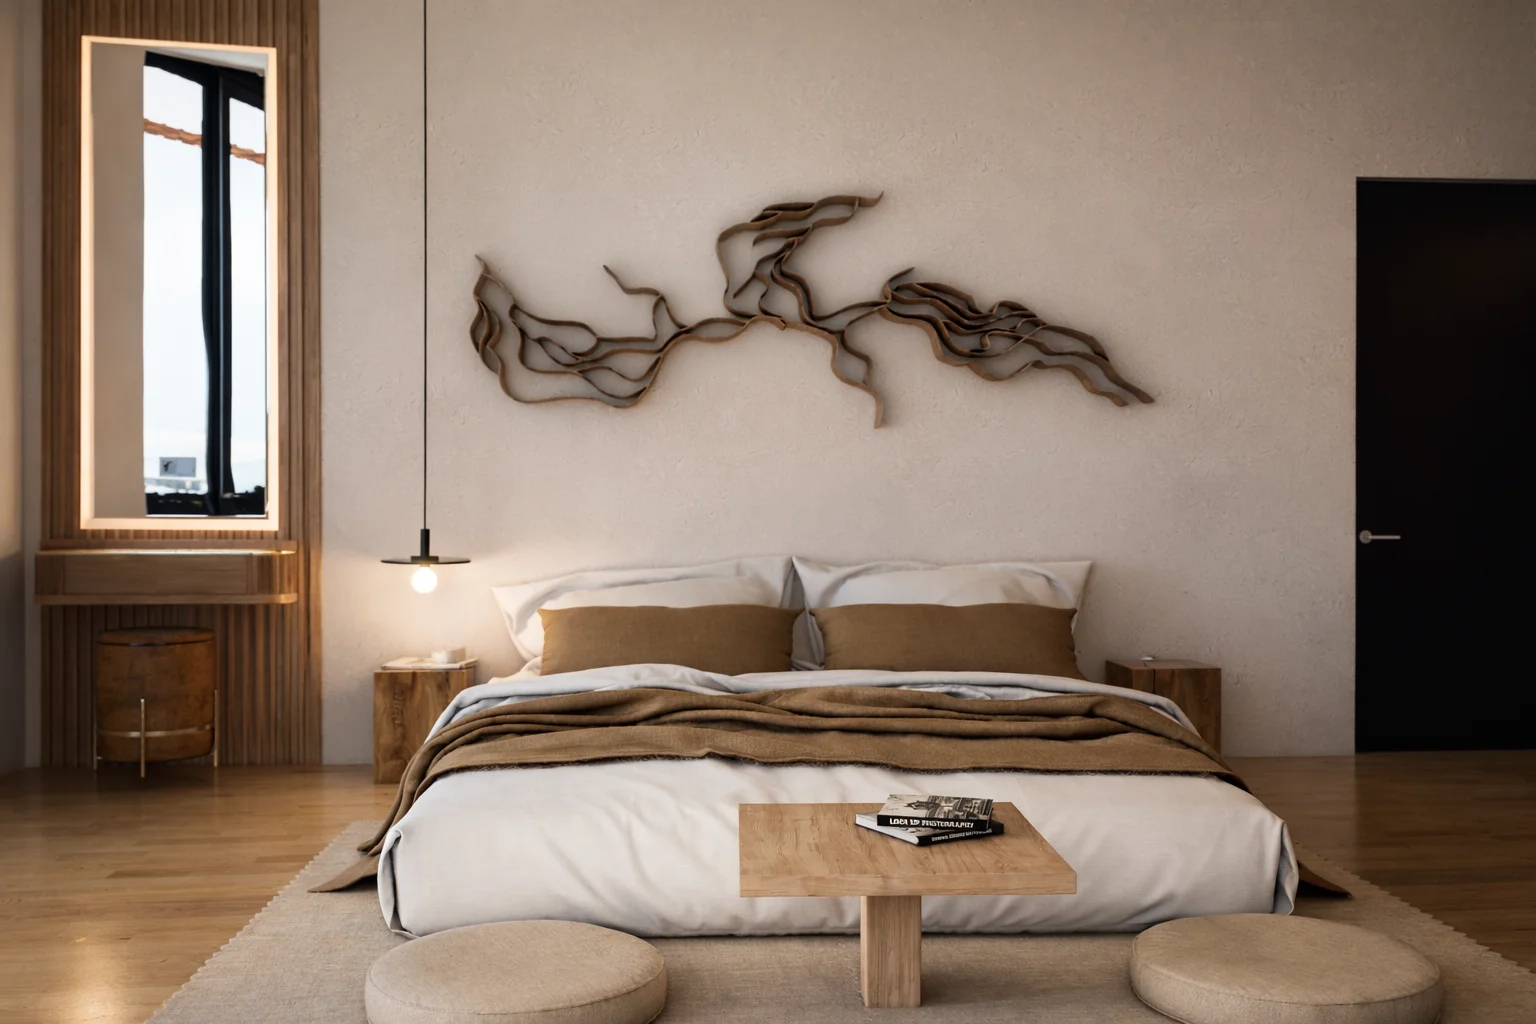
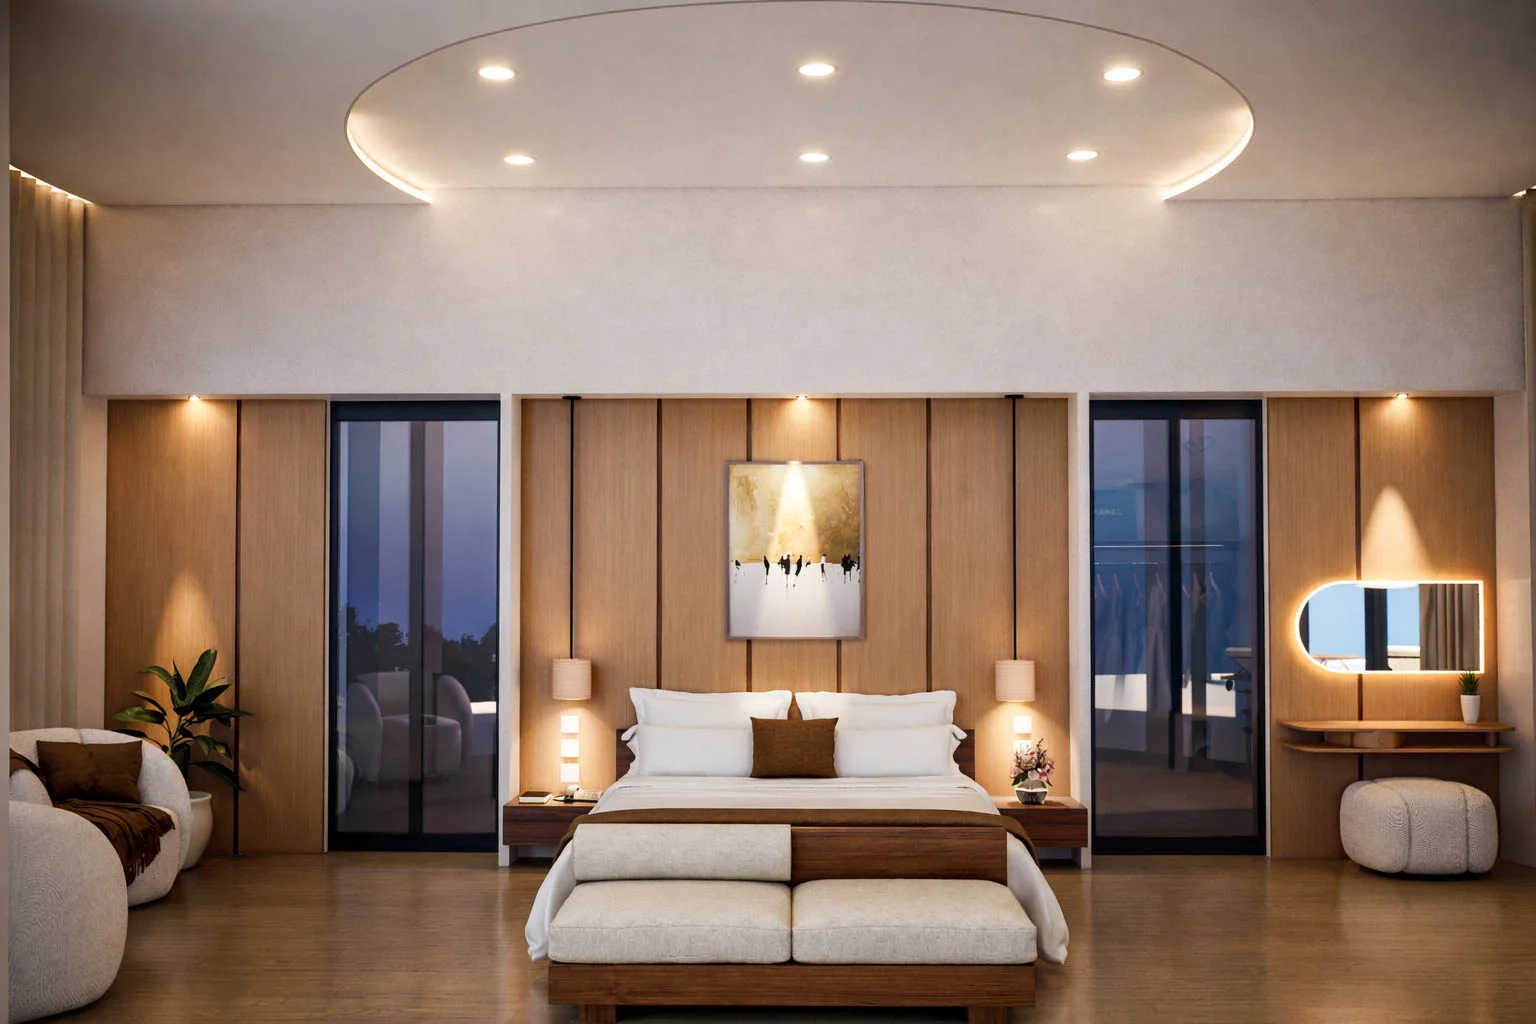
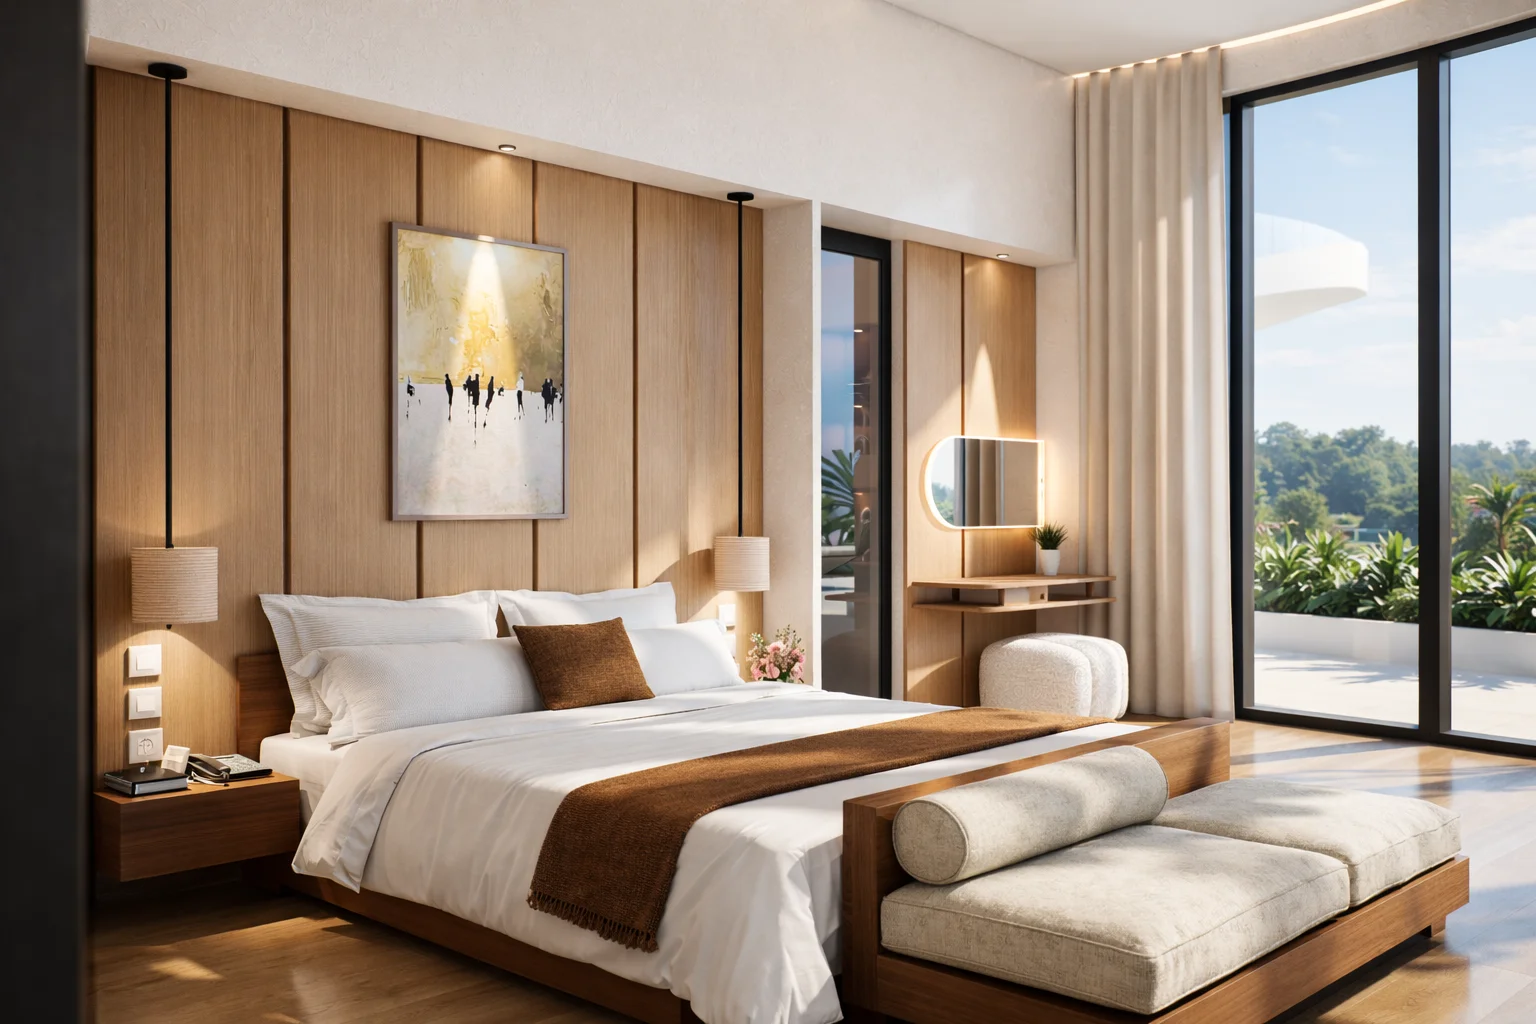
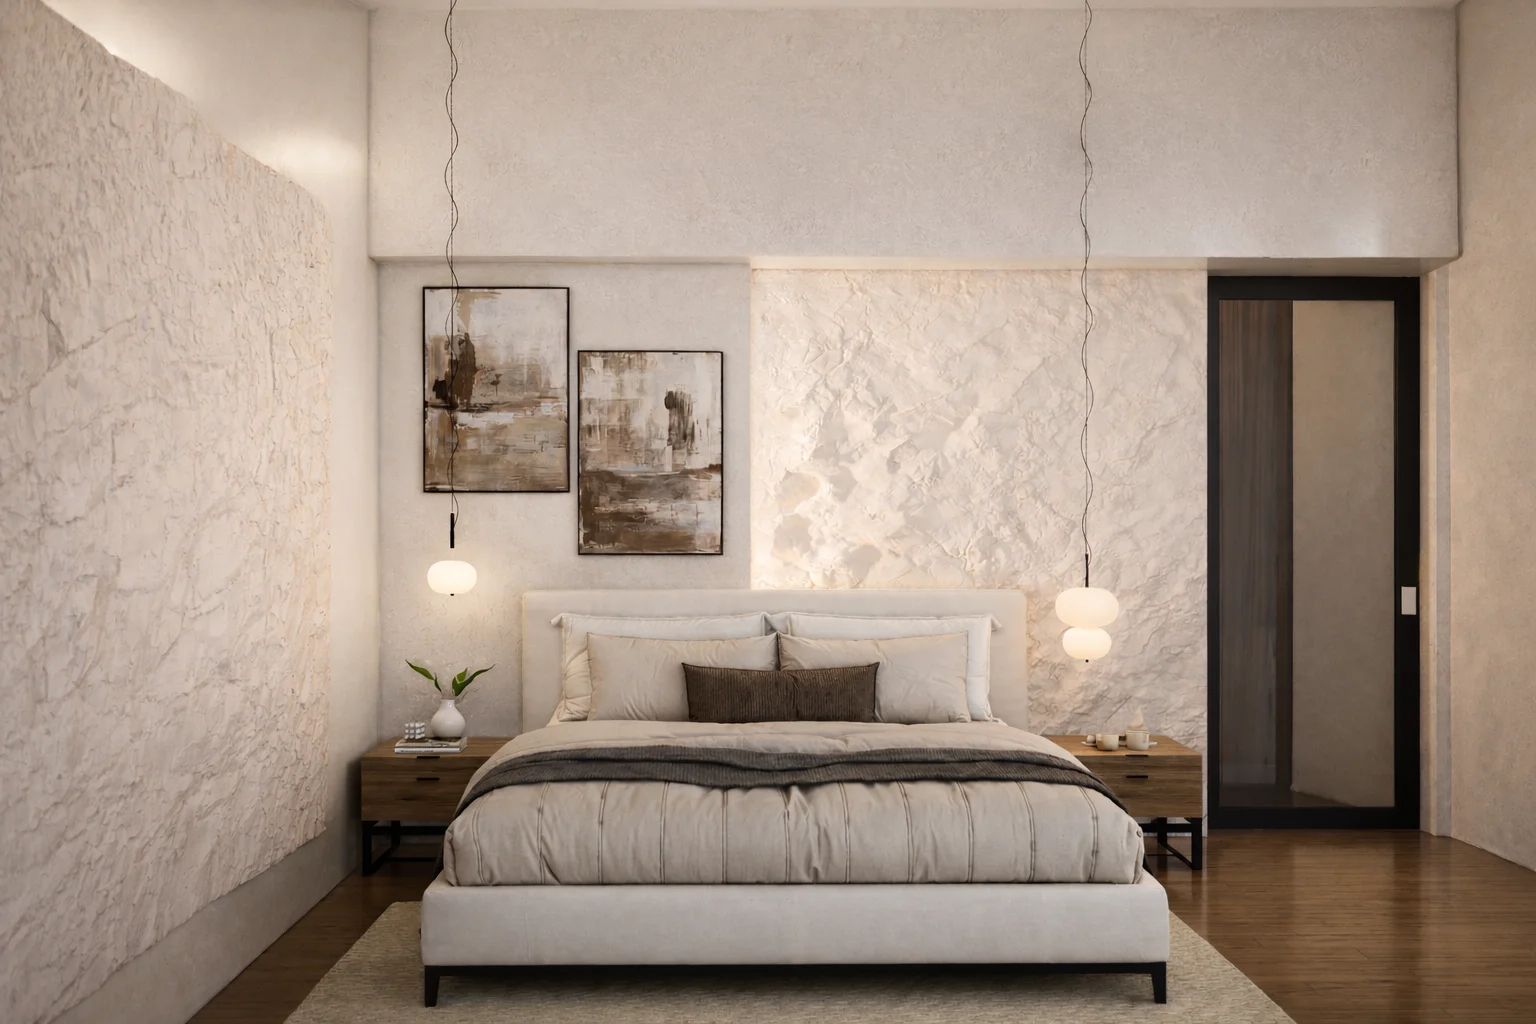
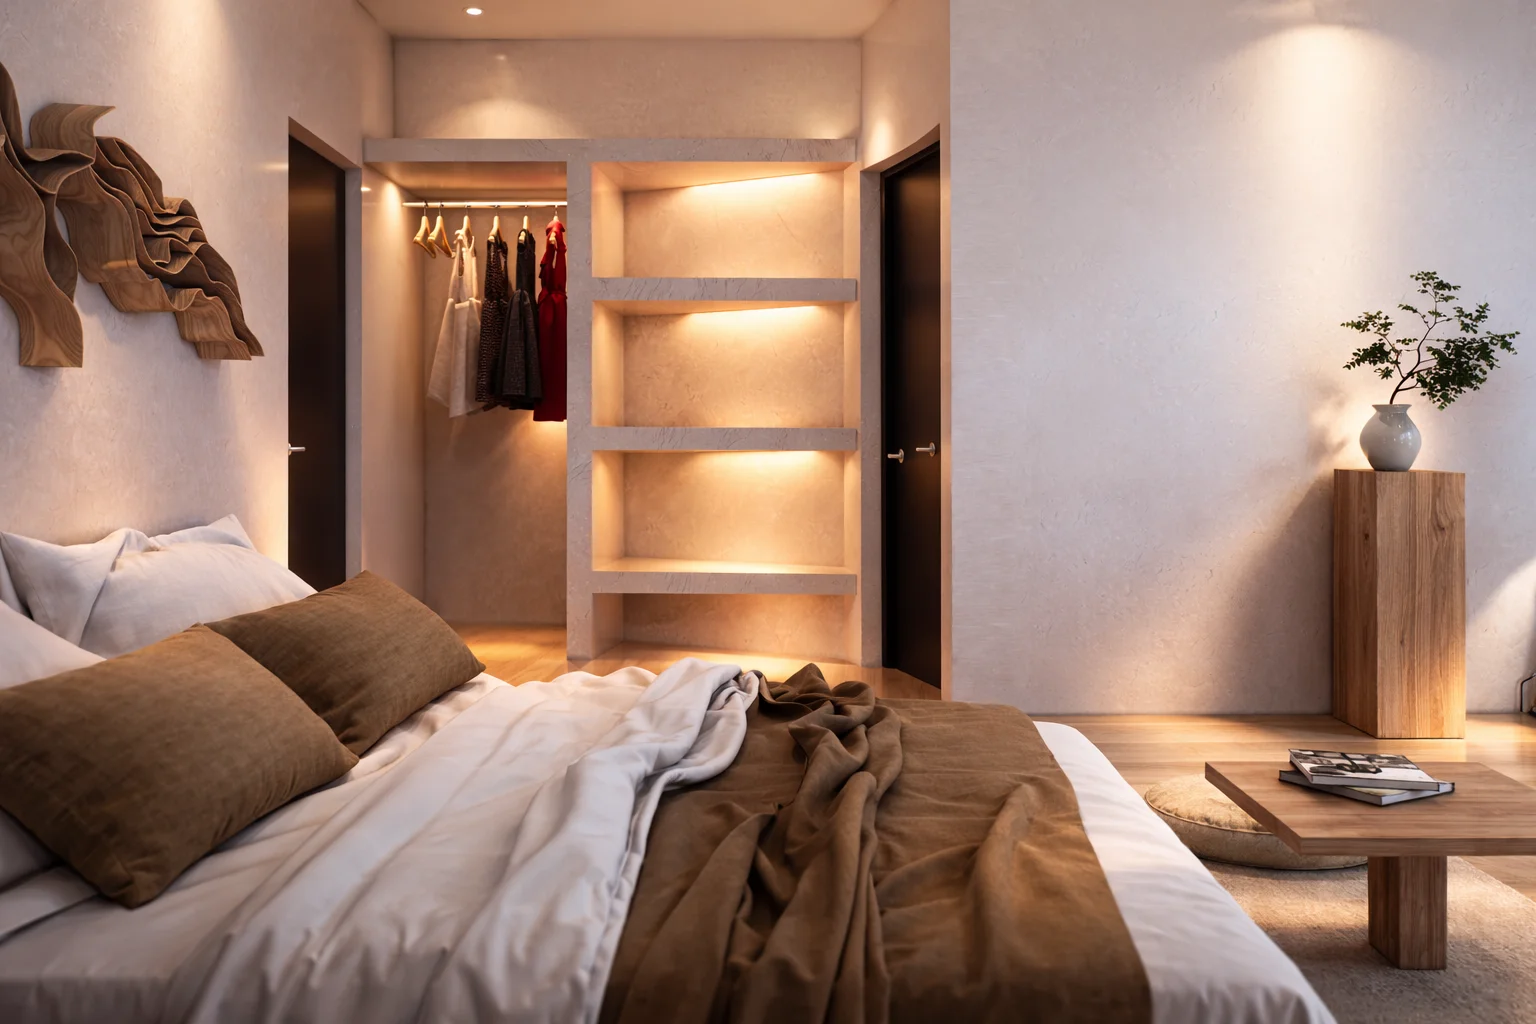
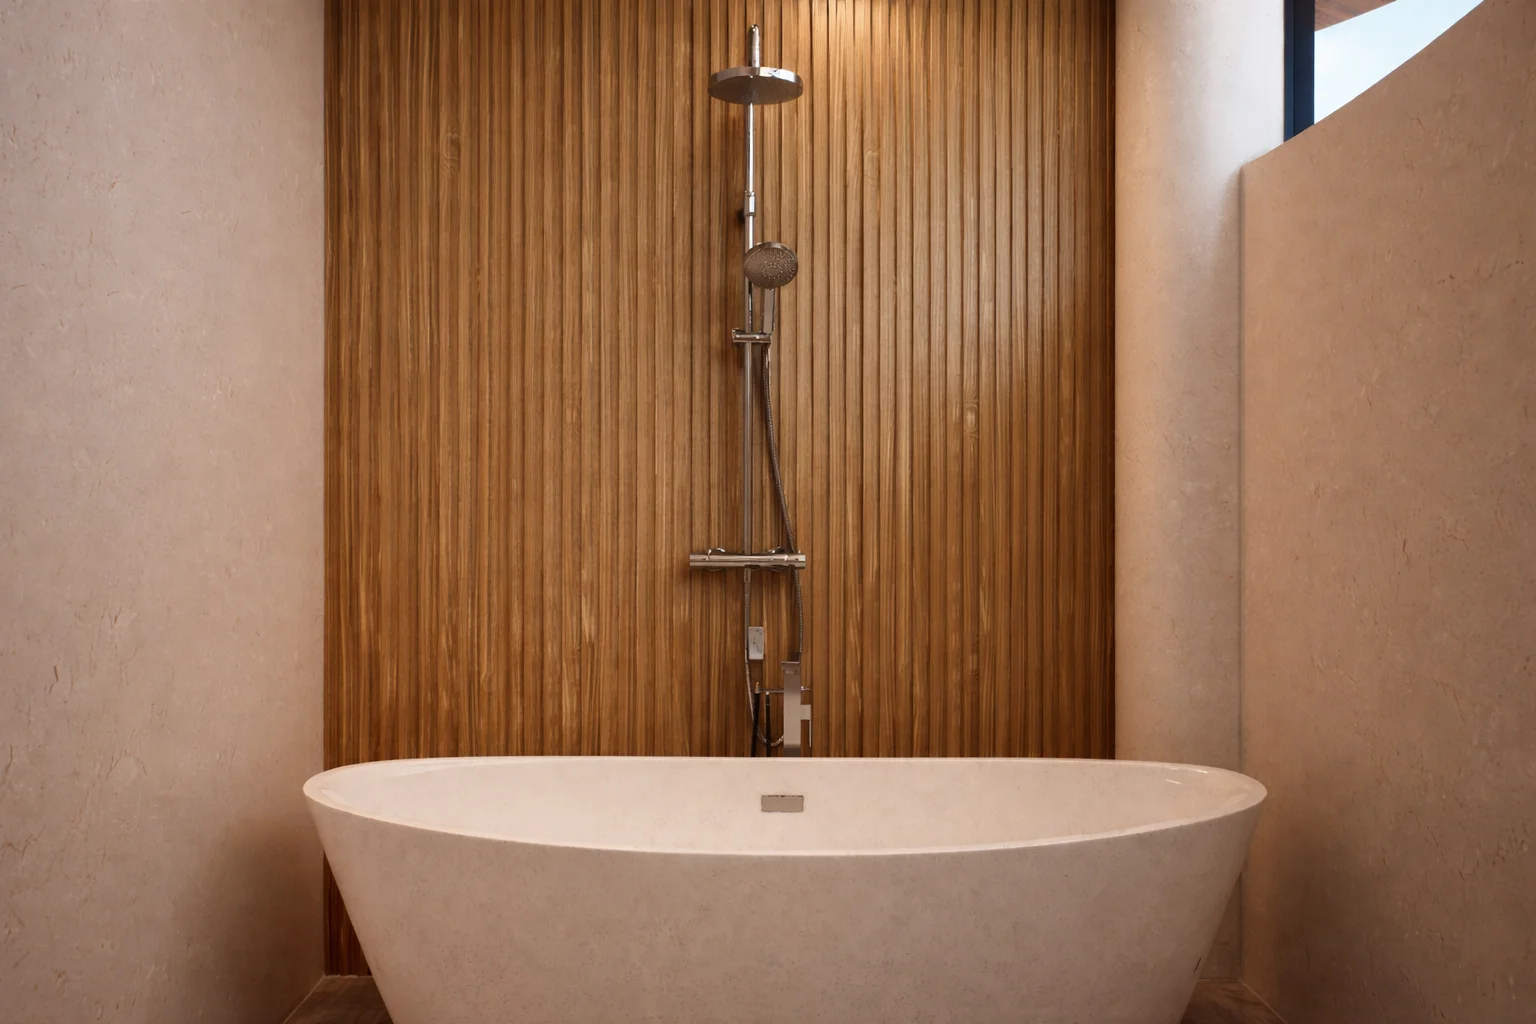
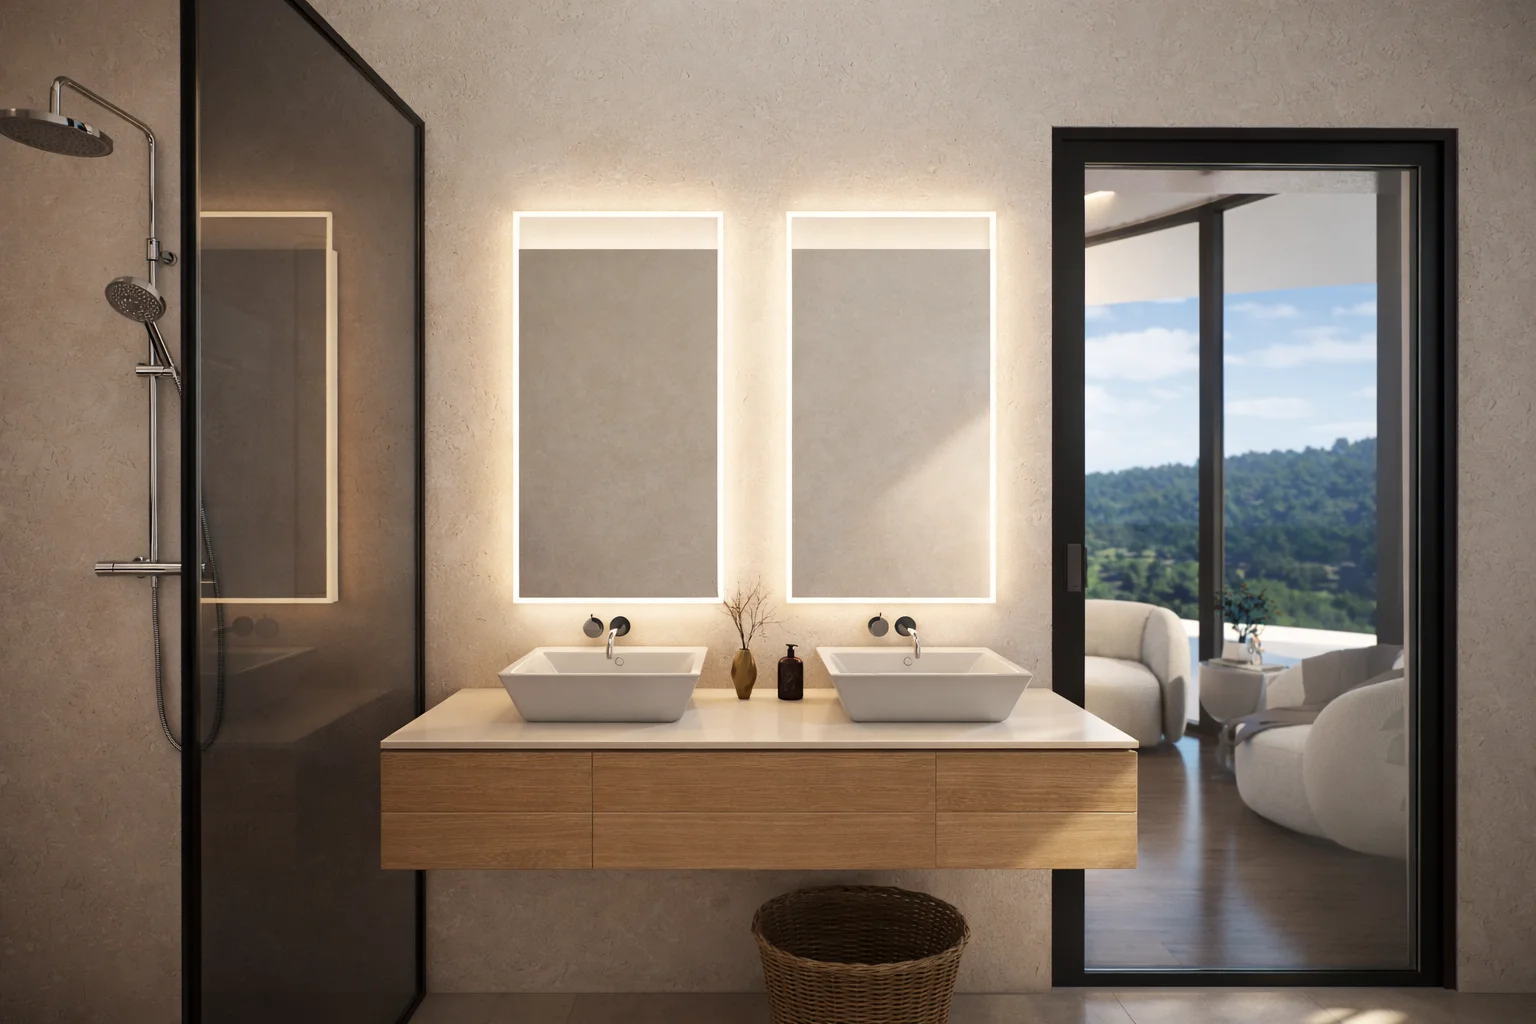
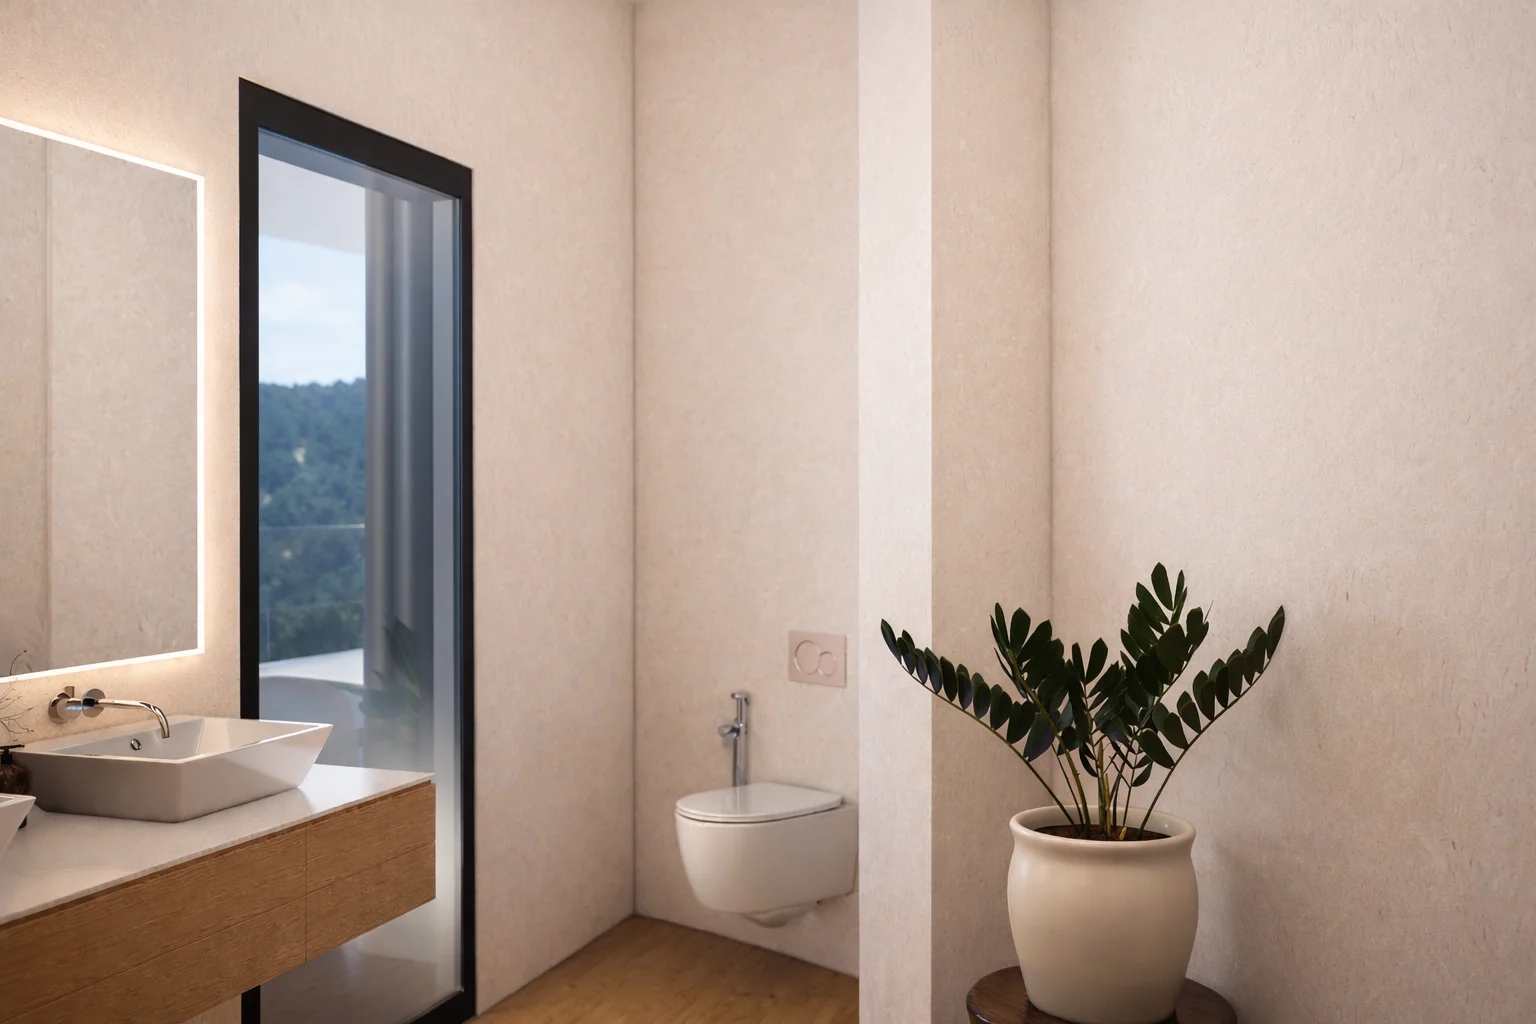
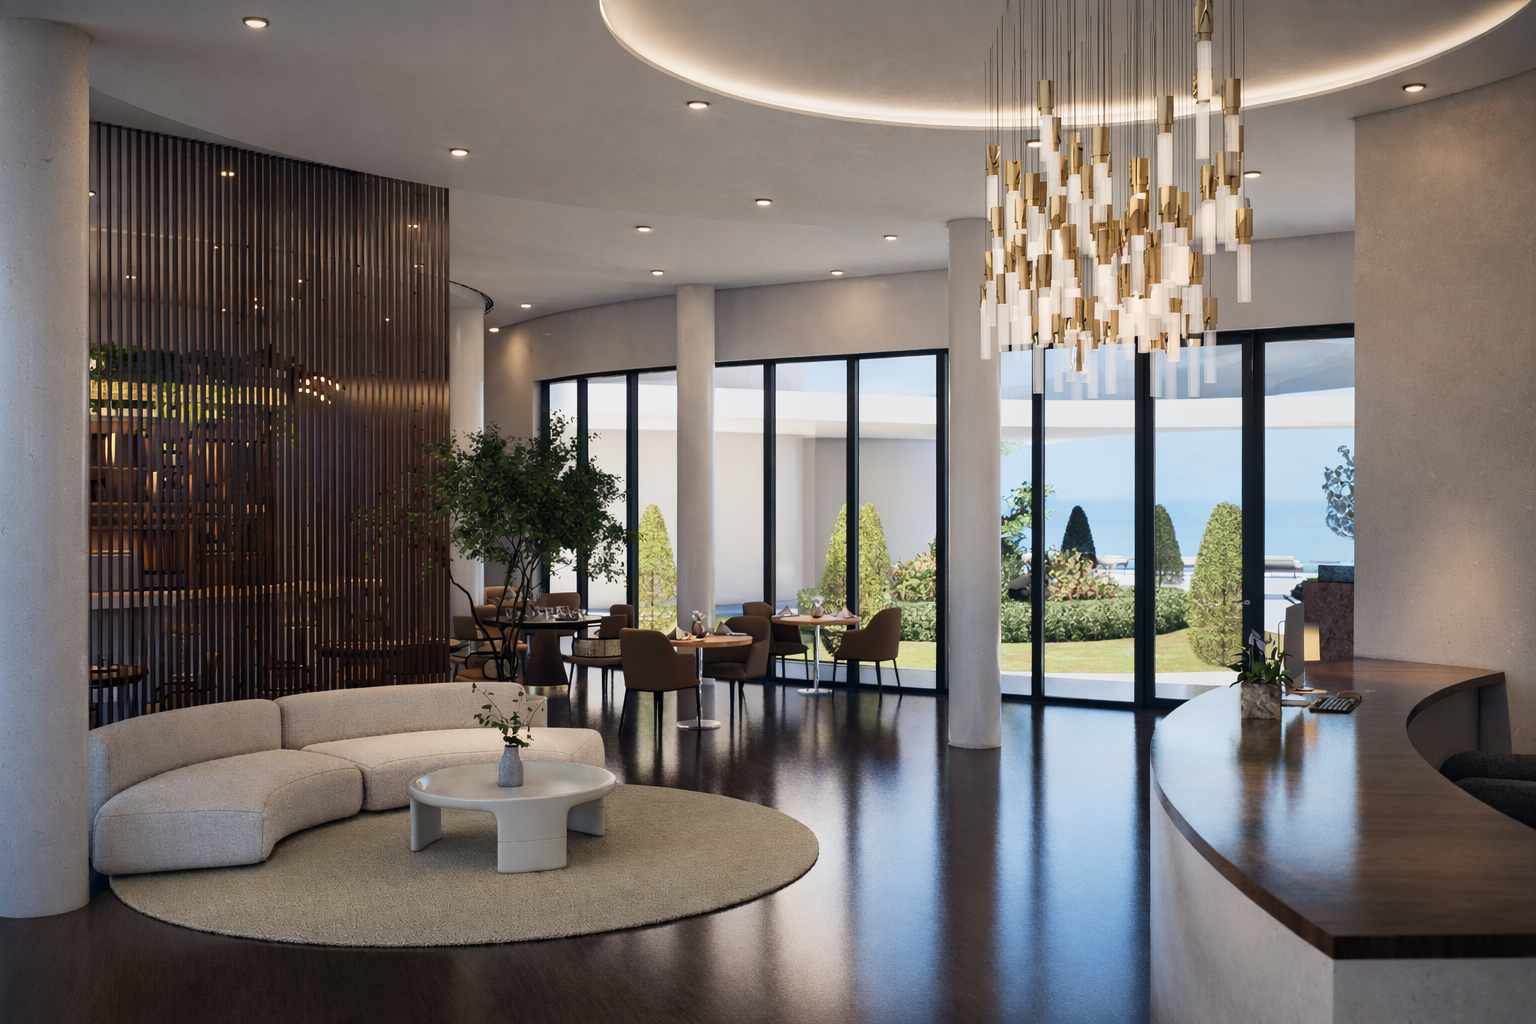
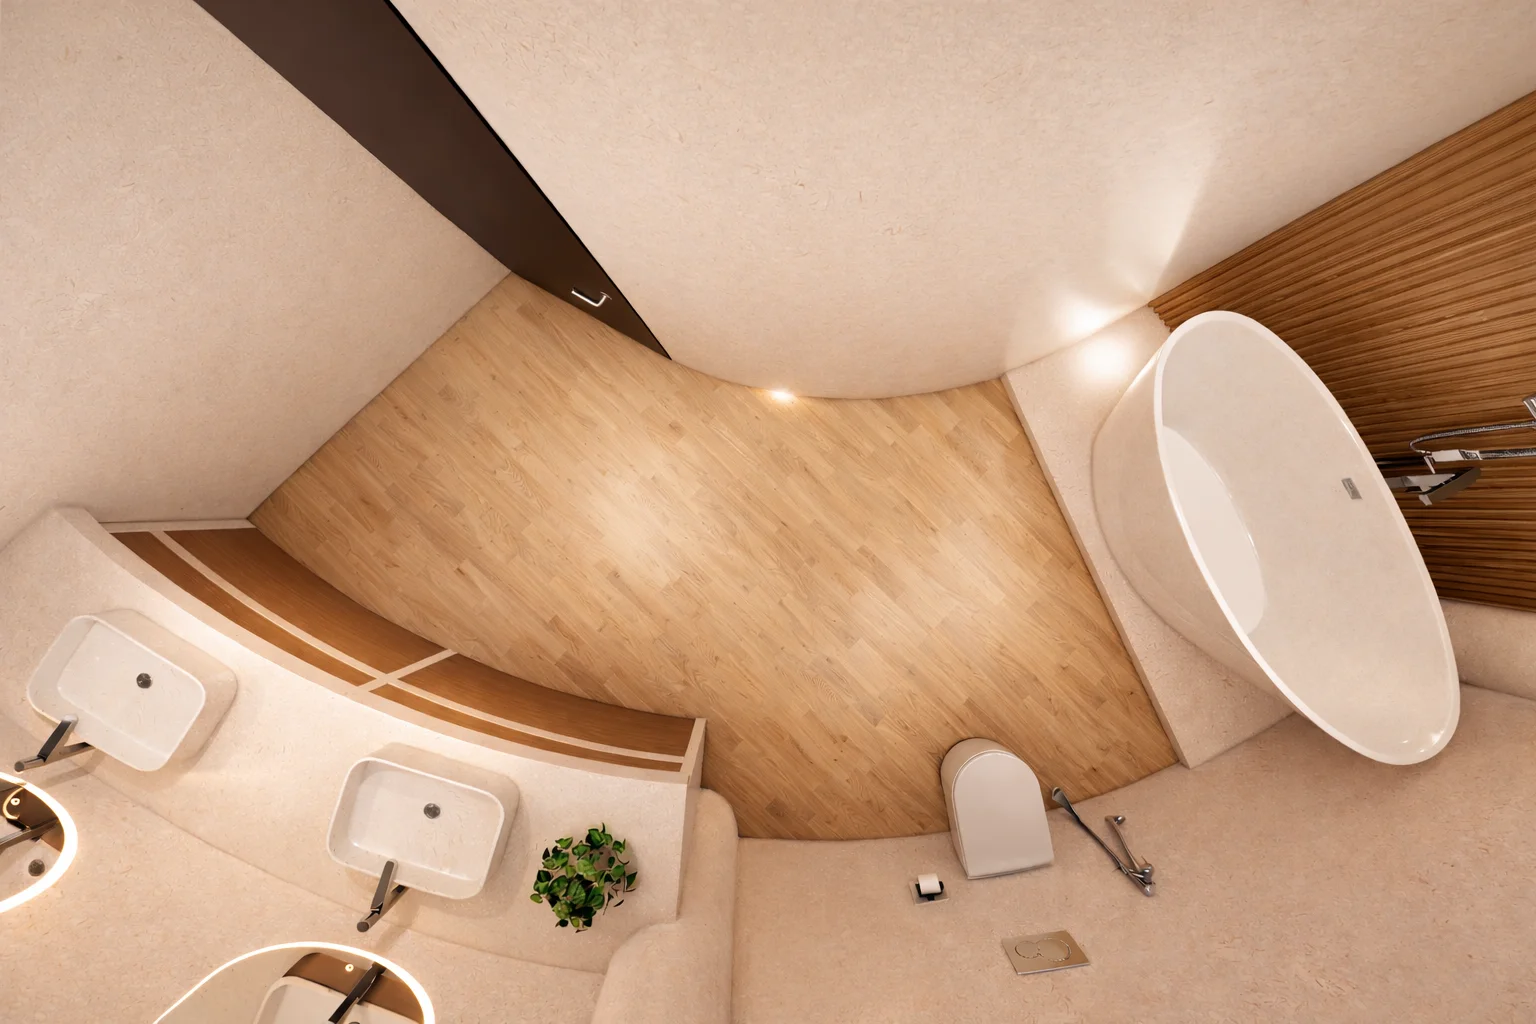
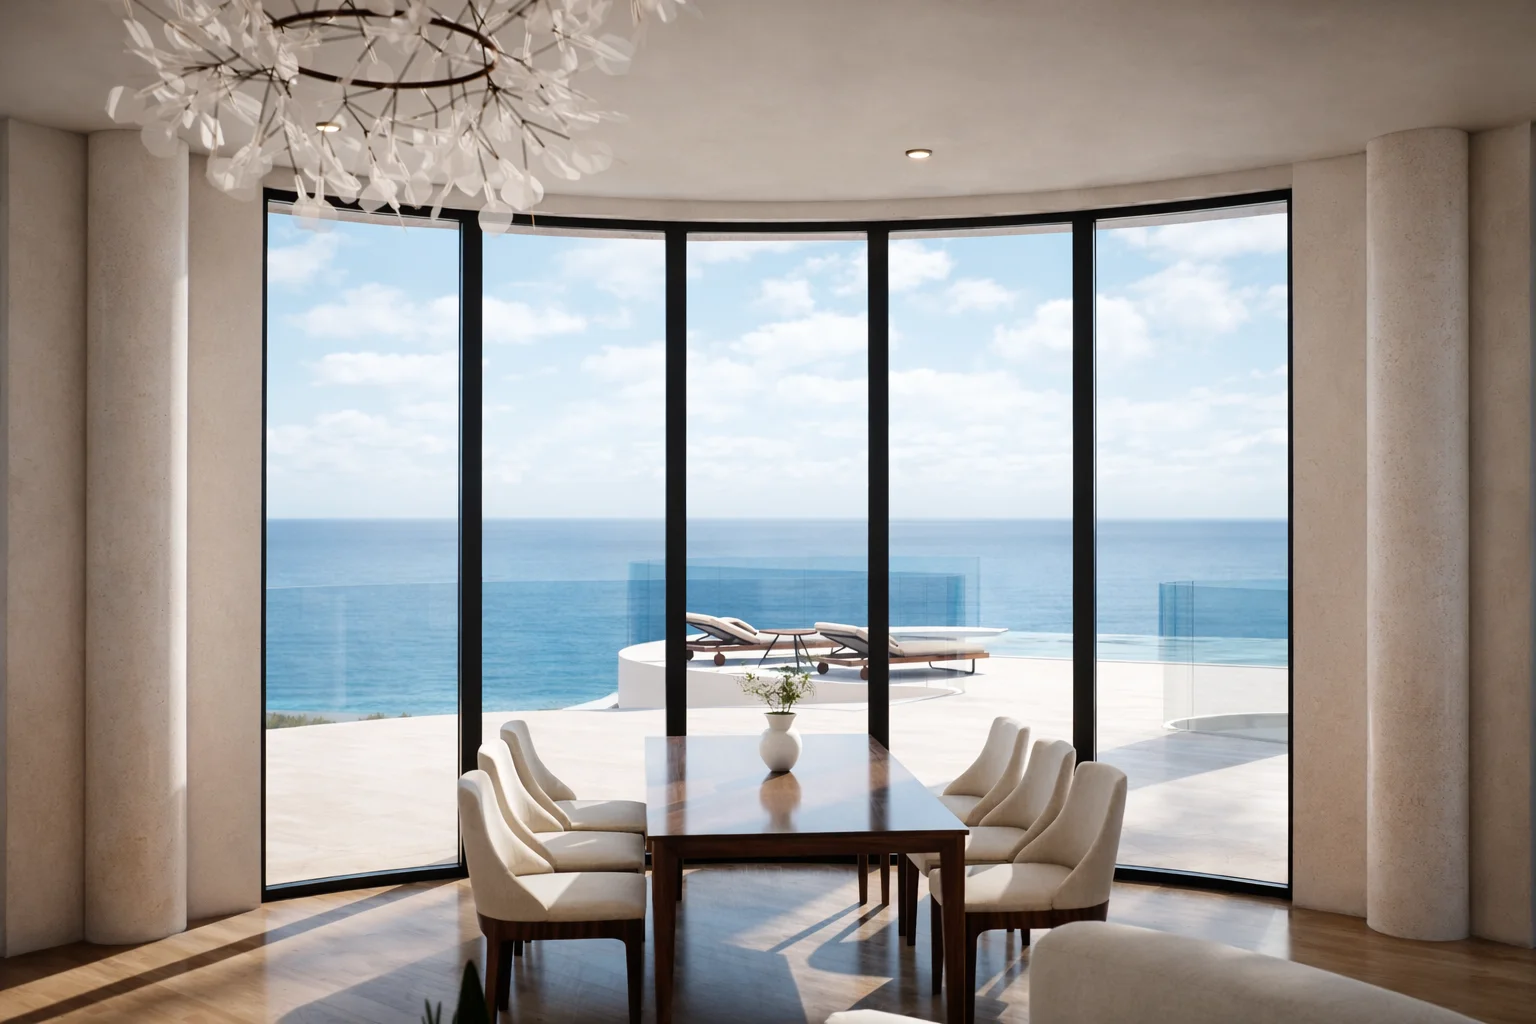
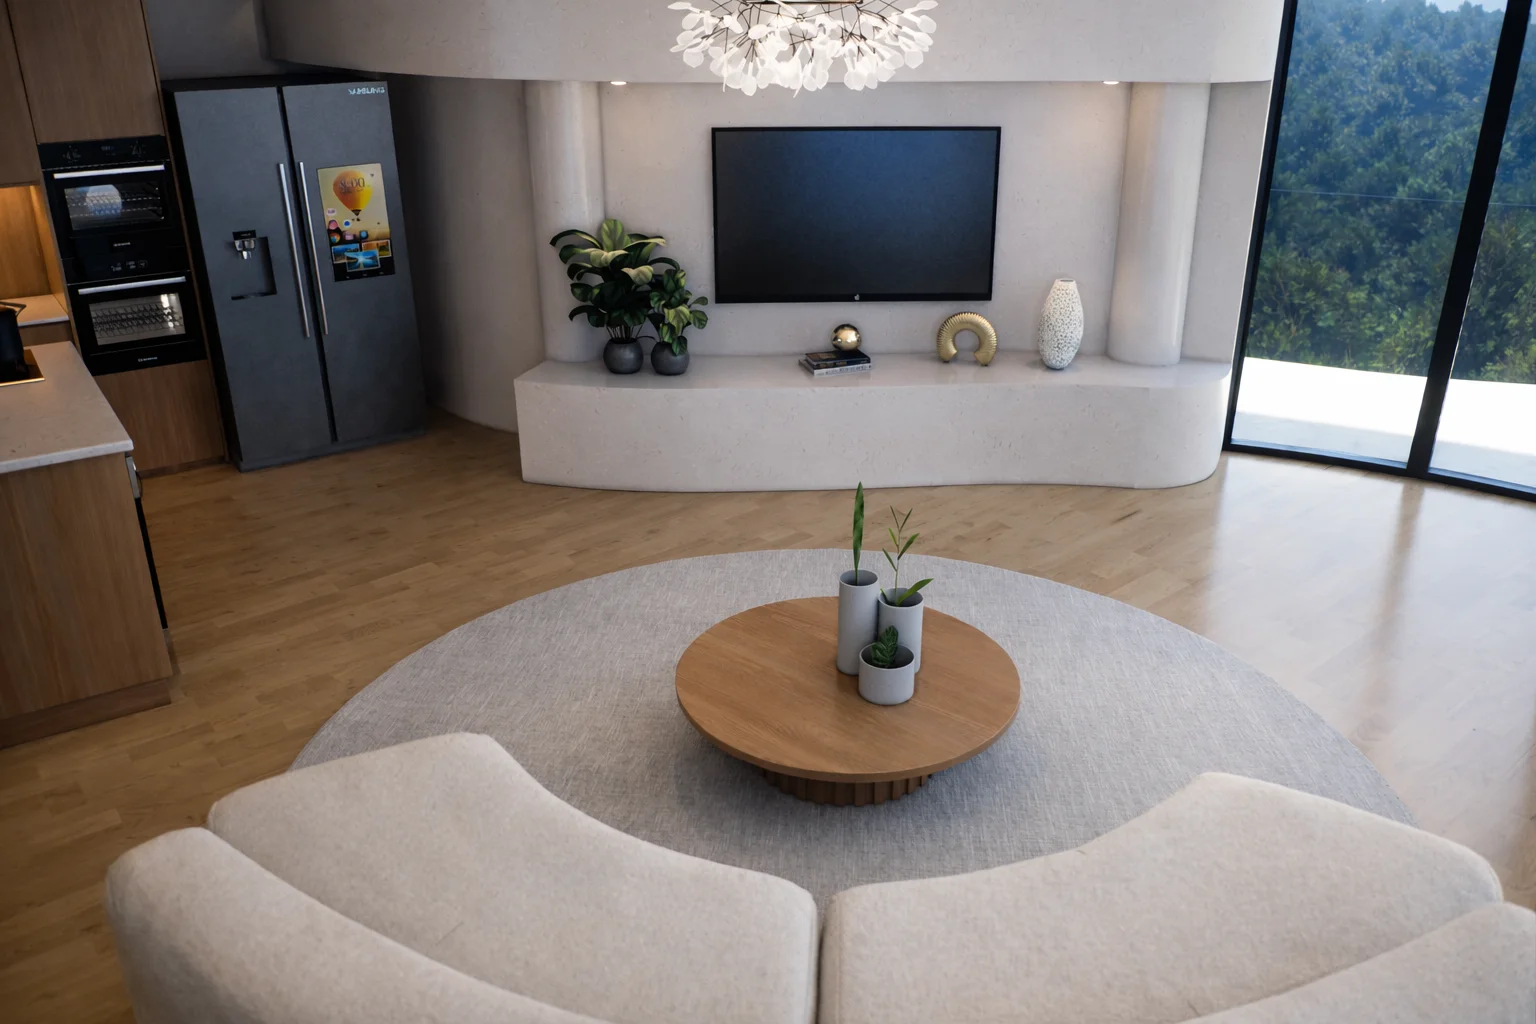
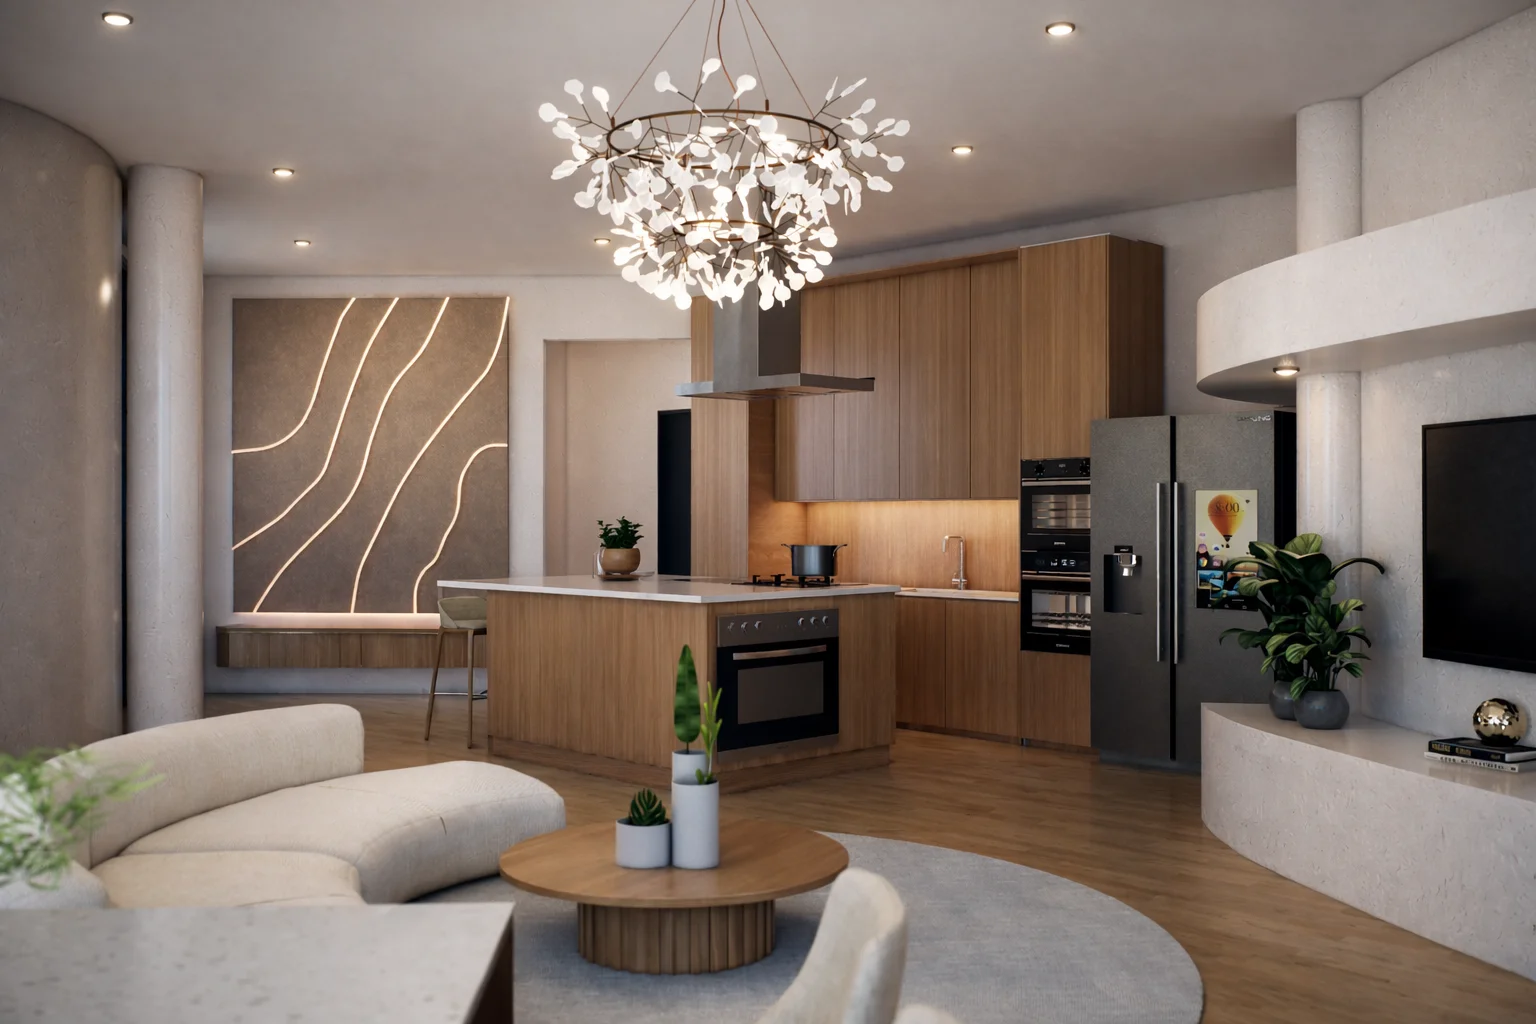
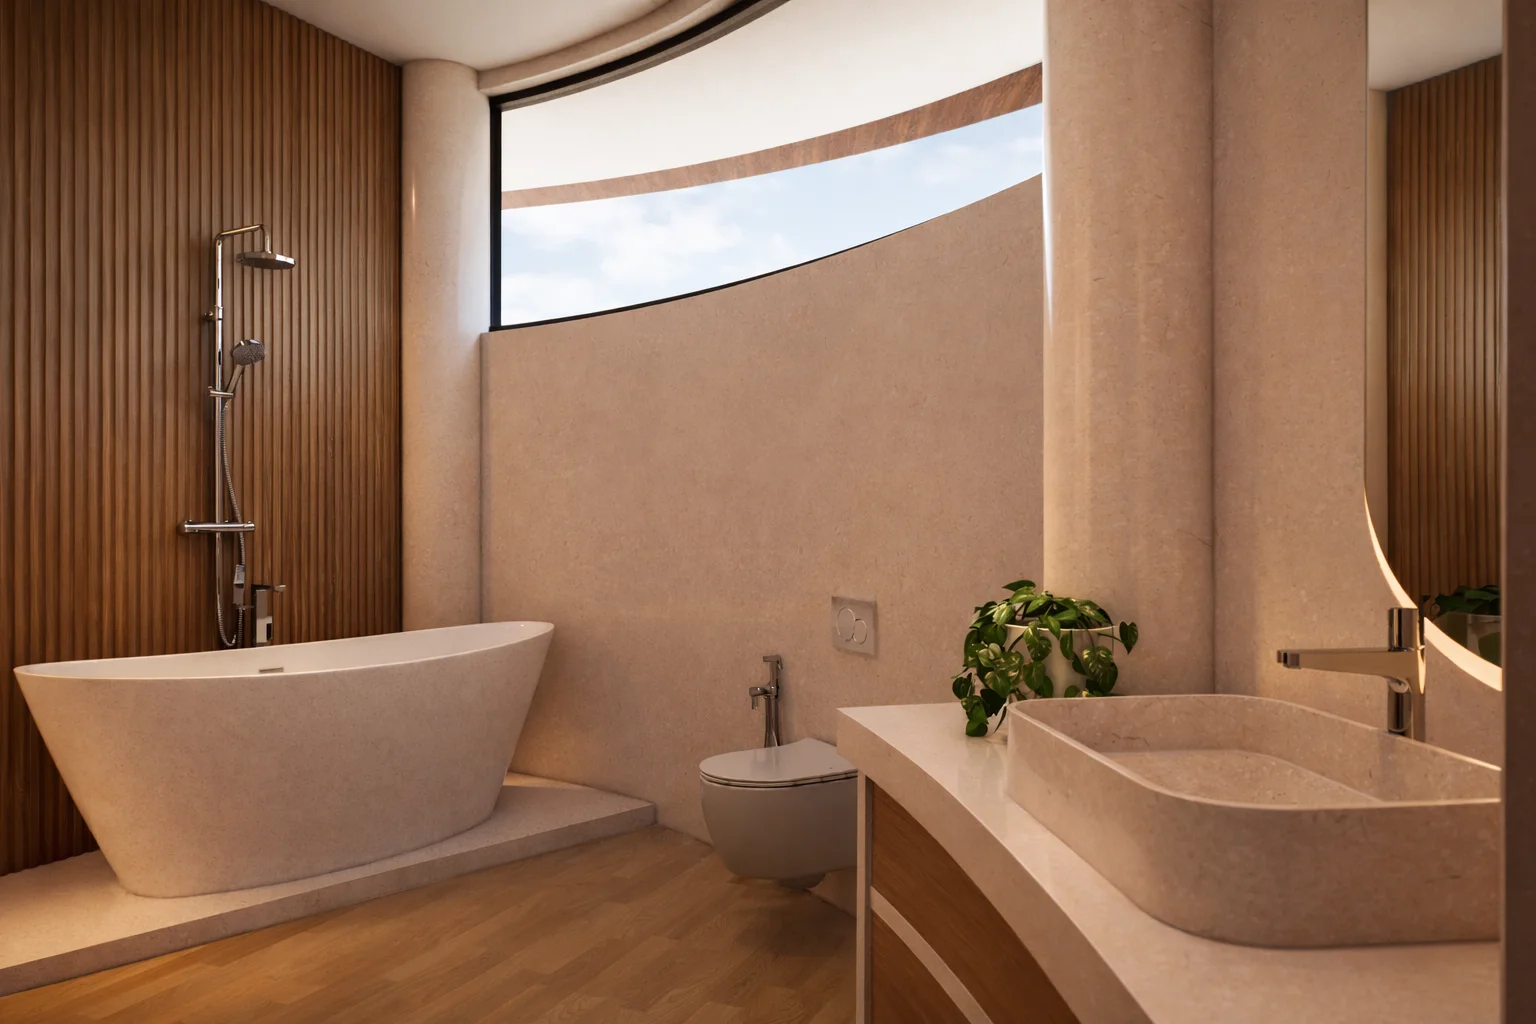
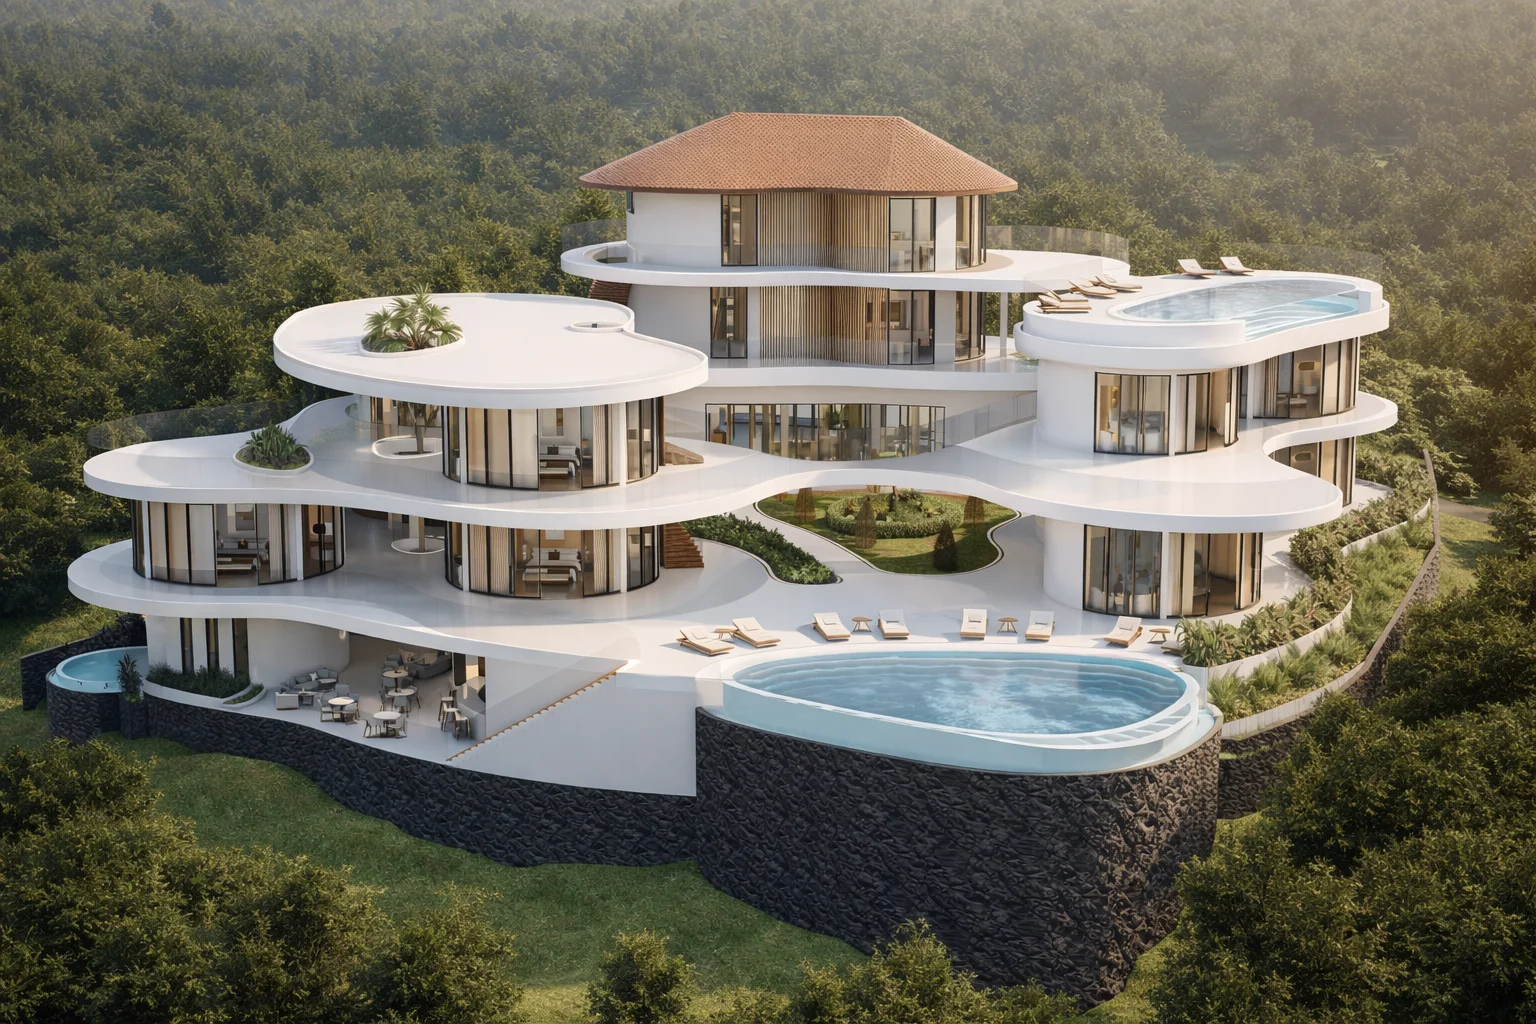
The Nusa Penida Cliffside project represents the pinnacle of eco-luxury architecture and high-end hospitality. Set upon a 5,000 sqm oceanfront estate with direct sea access, the resort masterfully integrates sustainable design with sophisticated living. Each of the 8 exclusive villas is envisioned as a private sanctuary, featuring bespoke interior design, private pools, and a seamless indoor-outdoor flow that redefines the luxury island experience.
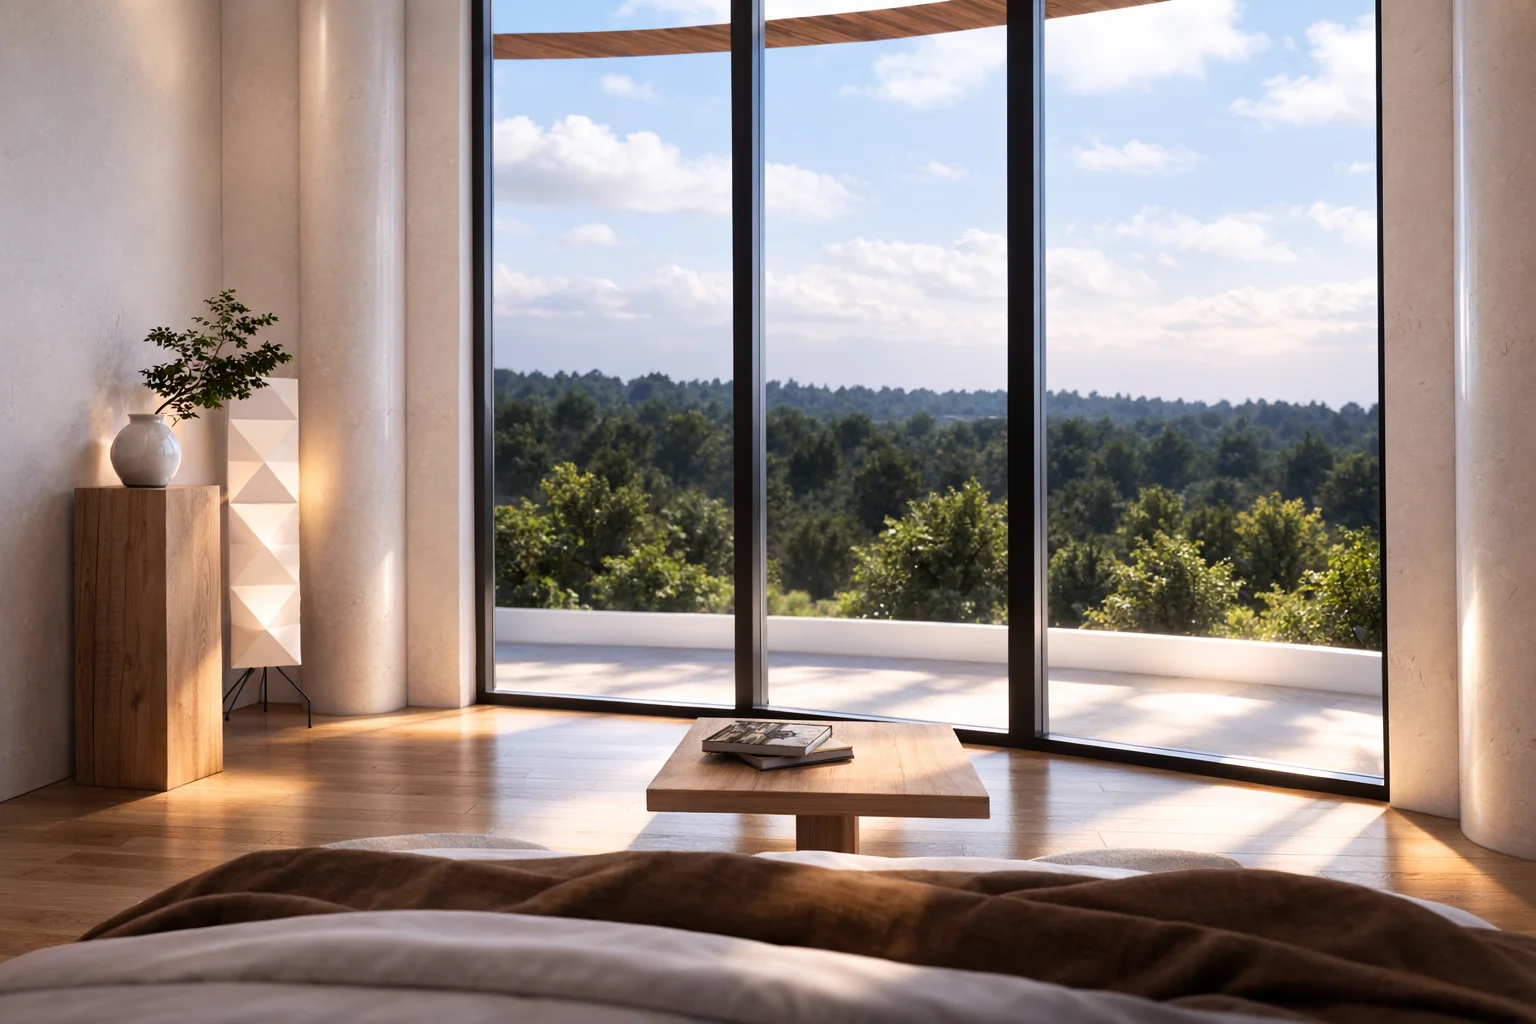
An exclusive boutique resort destination on the legendary island of Nusa Penida, featuring 8 ultra-luxury villas with breathtaking, infinite ocean views. This premier architectural development offers the ultimate luxury villa experience near Bali, combining sophisticated design with unparalleled coastal vistas.
€3,680k
€50k
22.70%
Pleine propriété
Découvrez la combinaison de villas et de suites haut de gamme qui génèrent les revenus du complexe, avec des tarifs journaliers moyens (ADR) adaptés selon l'exclusivité.
Rather than a simple average, the resort average daily rate (ADR) of €411.25 is calculated dynamically using a weighted average based on inventory mix. This yields highly precise, risk-adjusted yield pro-formas.
In luxury boutique operations, rooms drive only a portion of total yield. Pro-formas integrate additional revenue streams calculated as ratios of room revenues:
Nusa Penida: The emerging epicenter of eco-luxury tourism in Bali, witnessing record-breaking growth in the premium sector—a premier destination for sustainable architecture and high-end luxury villa development.


| Metric | Value |
|---|---|
| Land Cost | €736.000 (est.) |
| Construction Cost | €2.208.000 (est.) |
| Development Cost | €736.000 (est.) |
| Projected Exit Value | €5.520.000 (est.) |
| ROI | 22.70% |
| Timeline | 18 Mois |
Data-driven strategic analysis: transitioning from transient daily visitors to high-yield, extended luxury stays.
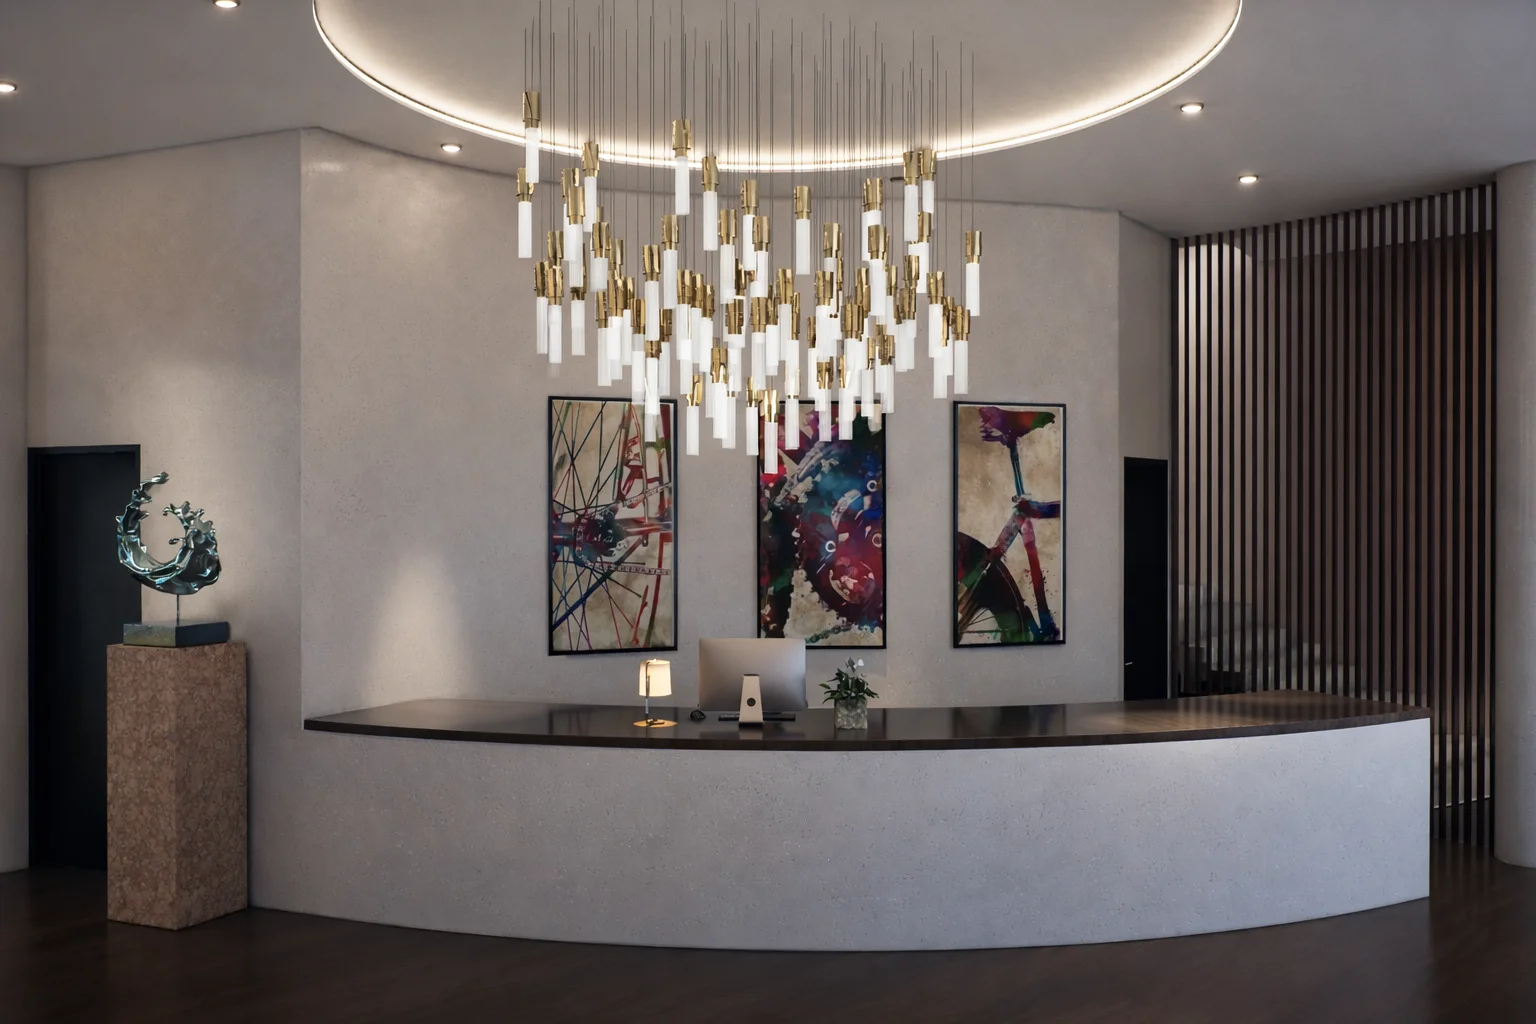
The project is strategically situated within the ultra-luxury hospitality segment of Nusa Penida, leveraging a prime cliffside location that ensures absolute privacy and panoramic ocean vistas. The signature Domo Resort architecture is not merely an aesthetic statement, but a calculated investment move designed to command a premium Average Daily Rate (ADR) significantly above the regional market average.
We implement a lean operational management model specifically engineered to minimize overhead and maximize EBITDA margins. The resort’s low-density master plan facilitates an elite guest-to-staff ratio, delivering a bespoke, high-end service experience without the prohibitive fixed costs typical of conventional large-scale hotel developments.
Nusa Penida has undergone a massive transformation, growing from 200,000 arrivals in 2017 to over 1.1 million in 2024. The market is currently at a critical inflection point: shifting from "day-trip" excursions to extended luxury stays. Institutional investors and the burgeoning "slow-travel" demographic are increasingly seeking exclusive, low-density environments. By securing a position in this privileged cliffside enclave, Antonio Rutilio Design captures the early maturity phase of the island’s luxury boom, offering projected capital appreciation that outpaces saturated markets like Canggu.
Simulez vos rendements en ajustant le montant de l'investissement ci-dessous.
27.1%
€1.9M
44.0%
5 Années
Année 7
€4.0M
€27.100
Basé sur le TRI 27.1%The project is designed as a low-density, high-margin boutique resort, optimizing both pricing and operational efficiency. Revenue is driven by premium positioning, ocean-view units, and strong demand for experiential hospitality in Nusa Penida.
Operating costs are controlled through a lean operational model and selective outsourcing of non-core services, ensuring maximum conversion to EBITDA.
>Nusa Penida is one of Bali’s fastest-growing destinations, with increasing demand for high-end, design-driven accommodations.
I'm sorry, but there is no content provided to localize. Please provide the text or content you would like to have localized for the English market.
The project targets a stabilized EBITDA margin of approximately 40–45%, generating consistent annual cash flow. Investors benefit from:
The project adopts a conservative financial approach with realistic occupancy and pricing assumptions.
Réduire la complexité opérationnelle et les frais généraux du personnel.
Identité architecturale prenant en charge l’ADR premium.
Sources de revenus d’hébergement, de restauration et de bien-être.
Implication directe du sponsor dans le développement et le contrôle.
Disclaimer: This material is for informational purposes only and does not constitute an offer or solicitation to invest. Details are provided upon request for qualified partners.
Ce graphique représente la répartition stratégique du montant total de l'investissement. L'architecture, les droits fonciers et les phases de construction sont priorisés pour garantir la longévité des actifs et un positionnement premium.
| Catégorie | Élément d'investissement | Montant |
|---|---|---|
| Acquisition de terrain | Freehold Acquisition | €720.000 |
| Construction | Main Structure & Roof | €1.500.000 |
| Meubles et intérieurs | Elite FF&E Package | €450.000 |
| Autre | Safety Reserve | €290.000 |
| Conception et architecture | Architectural & Technical Design | €300.000 |
| Meubles et intérieurs | Lighting & decoration | €80.000 |
| Meubles et intérieurs | Equipment (AC, system) | €120.000 |
| Gestion de projet | Project management | €70.000 |
| Conception et architecture | Engineering consultant | €50.000 |
| Permis et mentions légales | Building permits & licenses | €60.000 |
| Permis et mentions légales | Legal & company setup | €15.000 |
| Autre | Staff training & hiring | €25.000 |
| CAPITAL TOTAL ESTIMÉ | €3.680.000 | |
Ces chiffres représentent des références institutionnelles pour l'emplacement et la classe d'actifs. Le mode scénario modifie ces variables pour simuler le risque.
Revenu brut total généré au cours du cycle de vie du projet.
Capital net restant après tous frais et récupération des investissements.
Opérateur de performance hors éléments non monétaires et taxes.
Part des bénéfices nets attribuable à votre investissement spécifique.
Récupération totale du capital réalisée avant la phase de stabilisation. Ce modèle illustre un profil risque-rendement équilibré, avec une forte génération de flux de trésorerie et un calendrier clair de récupération du capital.
| Année | Occupation estimée | Revenu brut | Bénéfice d'exploitation (EBITDA) | Flux de trésorerie net |
|---|---|---|---|---|
| Year 1 | 55% | €1.212.028 | €387.849 | €318.036 |
| Year 2 | 65% | €1.475.369 | €531.133 | €435.529 |
| Year 3 | 75% | €1.751.932 | €700.773 | €574.634 |
| Year 4 | 77% | €1.849.555 | €776.813 | €636.987 |
| Year 5 | 75% | €1.851.097 | €814.483 | €667.876 |
| Year 6 | 75% | €1.900.680 | €836.299 | €685.766 |
| Year 7 | 75% | €1.950.263 | €858.116 | €703.655 |
| Year 8 | 75% | €1.999.846 | €879.932 | €721.545 |
| Year 9 | 75% | €2.049.429 | €901.749 | €739.434 |
| Year 10 | 75% | €2.099.012 | €923.565 | €757.324 |
| Year 11 | 75% | €2.161.983 | €951.272 | €780.043 |
| Year 12 | 75% | €2.226.842 | €979.811 | €803.445 |
| Year 13 | 75% | €2.293.647 | €1.009.205 | €827.548 |
| Year 14 | 75% | €2.362.457 | €1.039.481 | €852.374 |
| Year 15 | 75% | €2.433.331 | €1.070.665 | €877.946 |
| Year 16 | 75% | €2.506.331 | €1.102.785 | €904.284 |
| Year 17 | 75% | €2.581.520 | €1.135.869 | €931.413 |
| Year 18 | 75% | €2.658.966 | €1.169.945 | €959.355 |
| Year 19 | 75% | €2.738.735 | €1.205.043 | €988.136 |
| Year 20 | 75% | €2.820.897 | €1.241.195 | €1.017.780 |
| Year 21 | 75% | €2.905.524 | €1.278.431 | €1.048.313 |
| Year 22 | 75% | €2.992.690 | €1.316.783 | €1.079.762 |
| Year 23 | 75% | €3.082.470 | €1.356.287 | €1.112.155 |
| Year 24 | 75% | €3.174.945 | €1.396.976 | €1.145.520 |
| Year 25 | 75% | €3.270.193 | €1.438.885 | €1.179.886 |
| Year 26 | 75% | €3.368.299 | €1.482.051 | €1.215.282 |
| Year 27 | 75% | €3.469.348 | €1.526.513 | €1.251.741 |
| Year 28 | 75% | €3.573.428 | €1.572.308 | €1.289.293 |
| Year 29 | 75% | €3.680.631 | €1.619.478 | €1.327.972 |
| Year 30 | 75% | €3.791.050 | €1.668.062 | €1.367.811 |
| Year 31 | 75% | €3.904.781 | €1.718.104 | €1.408.845 |
| Year 32 | 75% | €4.021.925 | €1.769.647 | €1.451.110 |
| Year 33 | 75% | €4.142.582 | €1.822.736 | €1.494.644 |
| Year 34 | 75% | €4.266.860 | €1.877.418 | €1.539.483 |
| Year 35 | 75% | €4.394.866 | €1.933.741 | €1.585.668 |
| Year 36 | 75% | €4.526.712 | €1.991.753 | €1.633.238 |
| Year 37 | 75% | €4.662.513 | €2.051.506 | €1.682.235 |
| Year 38 | 75% | €4.802.388 | €2.113.051 | €1.732.702 |
| Year 39 | 75% | €4.946.460 | €2.176.442 | €1.784.683 |
| Year 40 | 75% | €5.094.854 | €2.241.736 | €1.838.223 |
| Year 41 | 75% | €5.247.700 | €2.308.988 | €1.893.370 |
| Year 42 | 75% | €5.405.130 | €2.378.257 | €1.950.171 |
| Year 43 | 75% | €5.567.284 | €2.449.605 | €2.008.676 |
| Year 44 | 75% | €5.734.303 | €2.523.093 | €2.068.936 |
| Year 45 | 75% | €5.906.332 | €2.598.786 | €2.131.005 |
| Year 46 | 75% | €6.083.522 | €2.676.750 | €2.194.935 |
| Year 47 | 75% | €6.266.028 | €2.757.052 | €2.260.783 |
| Year 48 | 75% | €6.454.008 | €2.839.764 | €2.328.606 |
| Year 49 | 75% | €6.647.629 | €2.924.957 | €2.398.464 |
| Year 50 | 75% | €6.847.058 | €3.012.705 | €2.470.418 |
| Year 51 | 75% | €7.052.469 | €3.103.087 | €2.544.531 |
| Year 52 | 75% | €7.264.043 | €3.196.179 | €2.620.867 |
| Year 53 | 75% | €7.481.965 | €3.292.064 | €2.699.493 |
| Year 54 | 75% | €7.706.424 | €3.390.826 | €2.780.478 |
| Year 55 | 75% | €7.937.616 | €3.492.551 | €2.863.892 |
| Year 56 | 75% | €8.175.745 | €3.597.328 | €2.949.809 |
| Year 57 | 75% | €8.421.017 | €3.705.248 | €3.038.303 |
| Year 58 | 75% | €8.673.648 | €3.816.405 | €3.129.452 |
| Year 59 | 75% | €8.933.857 | €3.930.897 | €3.223.336 |
| Year 60 | 75% | €9.201.873 | €4.048.824 | €3.320.036 |
| Year 61 | 75% | €9.477.929 | €4.170.289 | €3.419.637 |
| Year 62 | 75% | €9.762.267 | €4.295.397 | €3.522.226 |
| Year 63 | 75% | €10.055.135 | €4.424.259 | €3.627.893 |
| Year 64 | 75% | €10.356.789 | €4.556.987 | €3.736.729 |
| Year 65 | 75% | €10.667.493 | €4.693.697 | €3.848.831 |
| Year 66 | 75% | €10.987.517 | €4.834.508 | €3.964.296 |
| Year 67 | 75% | €11.317.143 | €4.979.543 | €4.083.225 |
| Year 68 | 75% | €11.656.657 | €5.128.929 | €4.205.722 |
| Year 69 | 75% | €12.006.357 | €5.282.797 | €4.331.894 |
| Year 70 | 75% | €12.366.548 | €5.441.281 | €4.461.850 |
| Year 71 | 75% | €12.737.544 | €5.604.519 | €4.595.706 |
| Year 72 | 75% | €13.119.670 | €5.772.655 | €4.733.577 |
| Year 73 | 75% | €13.513.261 | €5.945.835 | €4.875.584 |
| Year 74 | 75% | €13.918.658 | €6.124.210 | €5.021.852 |
| Year 75 | 75% | €14.336.218 | €6.307.936 | €5.172.507 |
| Year 76 | 75% | €14.766.305 | €6.497.174 | €5.327.683 |
| Year 77 | 75% | €15.209.294 | €6.692.089 | €5.487.513 |
| Year 78 | 75% | €15.665.573 | €6.892.852 | €5.652.139 |
| Year 79 | 75% | €16.135.540 | €7.099.637 | €5.821.703 |
| Year 80 | 75% | €16.619.606 | €7.312.627 | €5.996.354 |
| Year 81 | 75% | €17.118.194 | €7.532.005 | €6.176.244 |
| Year 82 | 75% | €17.631.740 | €7.757.966 | €6.361.532 |
| Year 83 | 75% | €18.160.692 | €7.990.705 | €6.552.378 |
| Year 84 | 75% | €18.705.513 | €8.230.426 | €6.748.949 |
| Year 85 | 75% | €19.266.678 | €8.477.338 | €6.951.418 |
| Year 86 | 75% | €19.844.679 | €8.731.659 | €7.159.960 |
| Year 87 | 75% | €20.440.019 | €8.993.608 | €7.374.759 |
| Year 88 | 75% | €21.053.220 | €9.263.417 | €7.596.002 |
| Year 89 | 75% | €21.684.816 | €9.541.319 | €7.823.882 |
| Year 90 | 75% | €22.335.361 | €9.827.559 | €8.058.598 |
| Year 91 | 75% | €23.005.421 | €10.122.385 | €8.300.356 |
| Year 92 | 75% | €23.695.584 | €10.426.057 | €8.549.367 |
| Year 93 | 75% | €24.406.452 | €10.738.839 | €8.805.848 |
| Year 94 | 75% | €25.138.645 | €11.061.004 | €9.070.023 |
| Year 95 | 75% | €25.892.805 | €11.392.834 | €9.342.124 |
| Year 96 | 75% | €26.669.589 | €11.734.619 | €9.622.388 |
| Year 97 | 75% | €27.469.676 | €12.086.658 | €9.911.059 |
| Year 98 | 75% | €28.293.767 | €12.449.257 | €10.208.391 |
| Year 99 | 75% | €29.142.580 | €12.822.735 | €10.514.643 |
| Year 100 | 75% | €30.016.857 | €13.207.417 | €10.830.082 |
+3.50% Annuel
+2.50% Annuel
11.4% Cible
| ADR \ OCC | 65% | 70% | 75% | 80% | 85% |
|---|---|---|---|---|---|
| €200 | 21.3% | 22.6% | 23.9% | 25.2% | 26.5% |
| €225 | 23.4% | 24.9% | 26.3% | 27.8% | 29.2% |
| €250 | 25.5% | 27.1% | 28.7% | 30.4% | 32.0% |
| €275 | 27.6% | 29.4% | 31.2% | 33.0% | 34.7% |
| €300 | 29.7% | 31.7% | 33.6% | 35.5% | 37.5% |
Legal Disclaimer: This sensitivity analysis is based on historical market performance and projected operational standards in Nusa Penida. Actual results may vary depending on global tourism trends, local regulations, and macroeconomic factors. This is not a guarantee of future returns.
Téléchargez l'aperçu technique et financier complet du projet.
Exclusivement disponible pour les investisseurs autorisés.
Inscrivez-vous pour accéder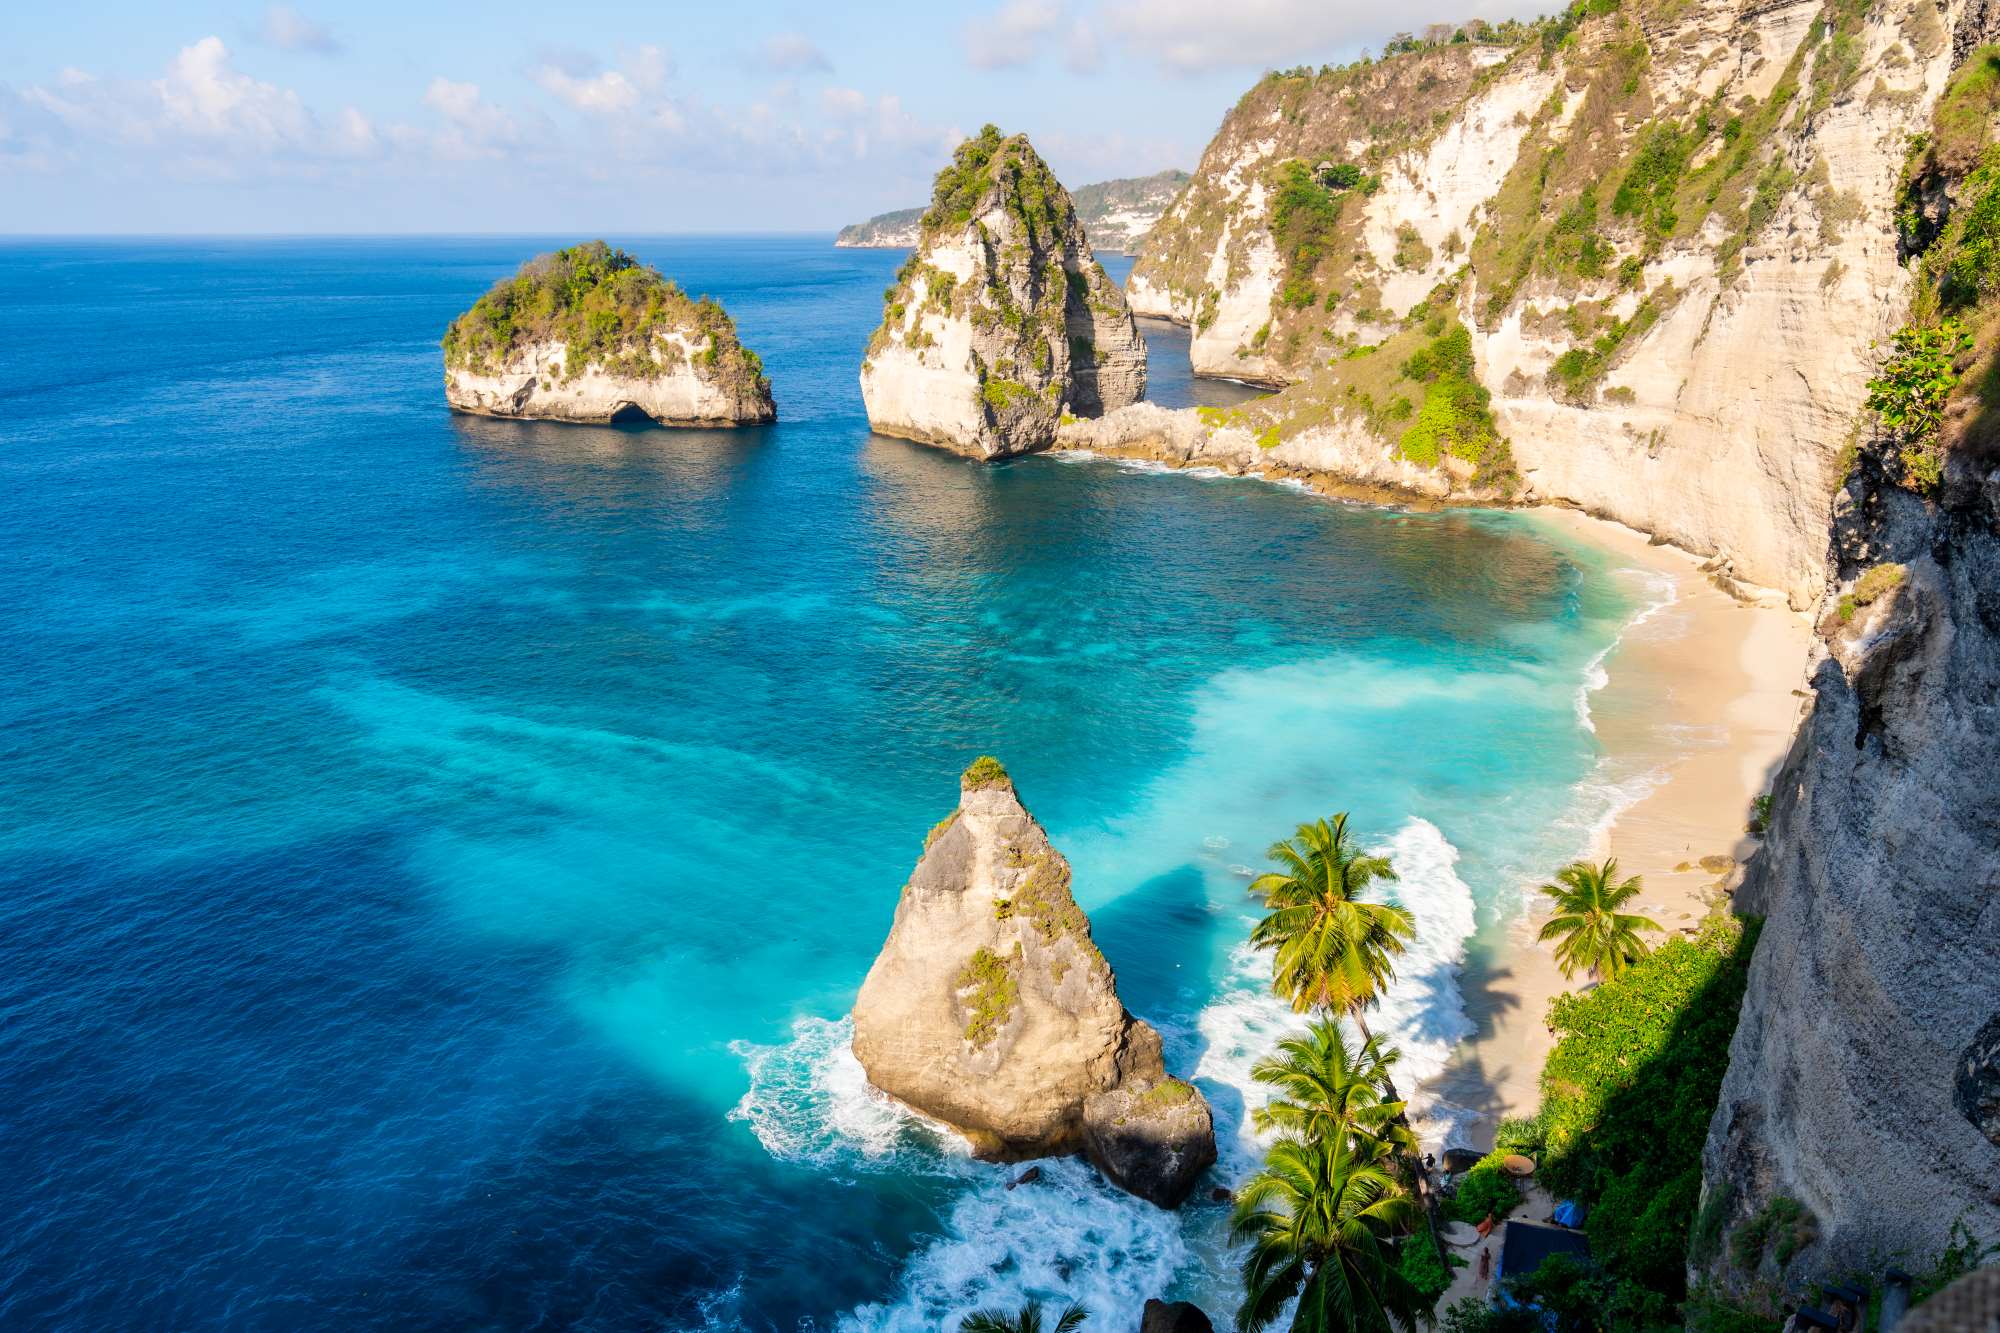
Spectaculaire plage de sable blanc à flanc de falaise, à la pointe orientale de Nusa Penida.

La célèbre falaise en forme de T-Rex et la plage de sable blanc immaculée en contrebas.
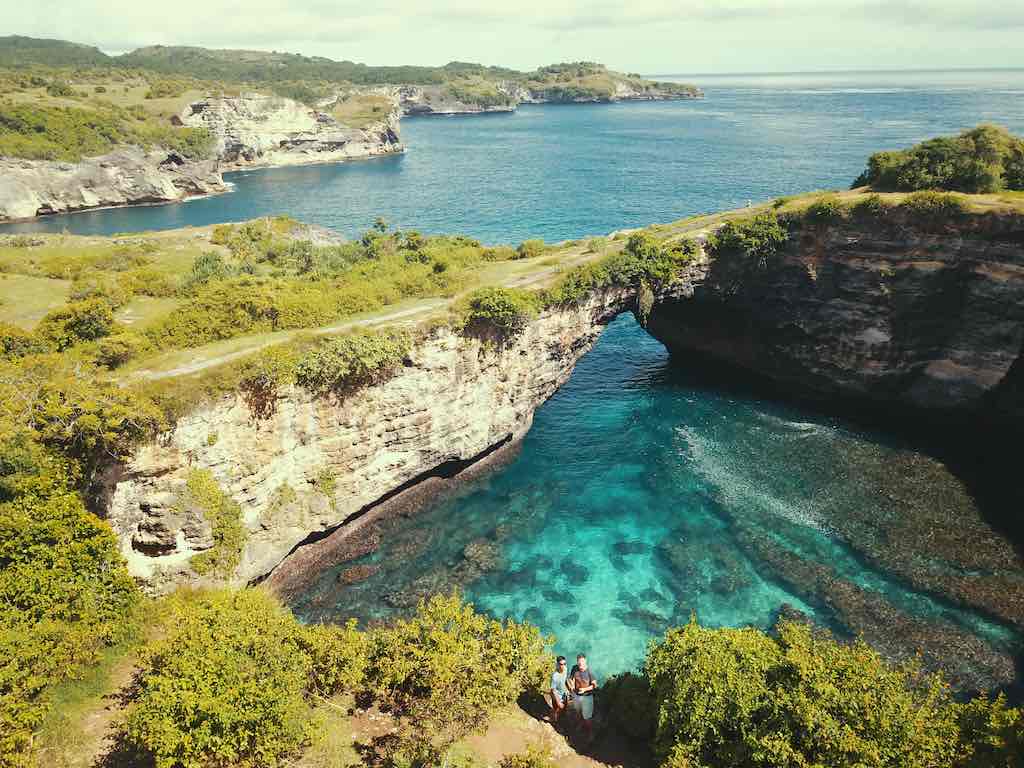
Une arche naturelle pittoresque sur une crique de mer turquoise.
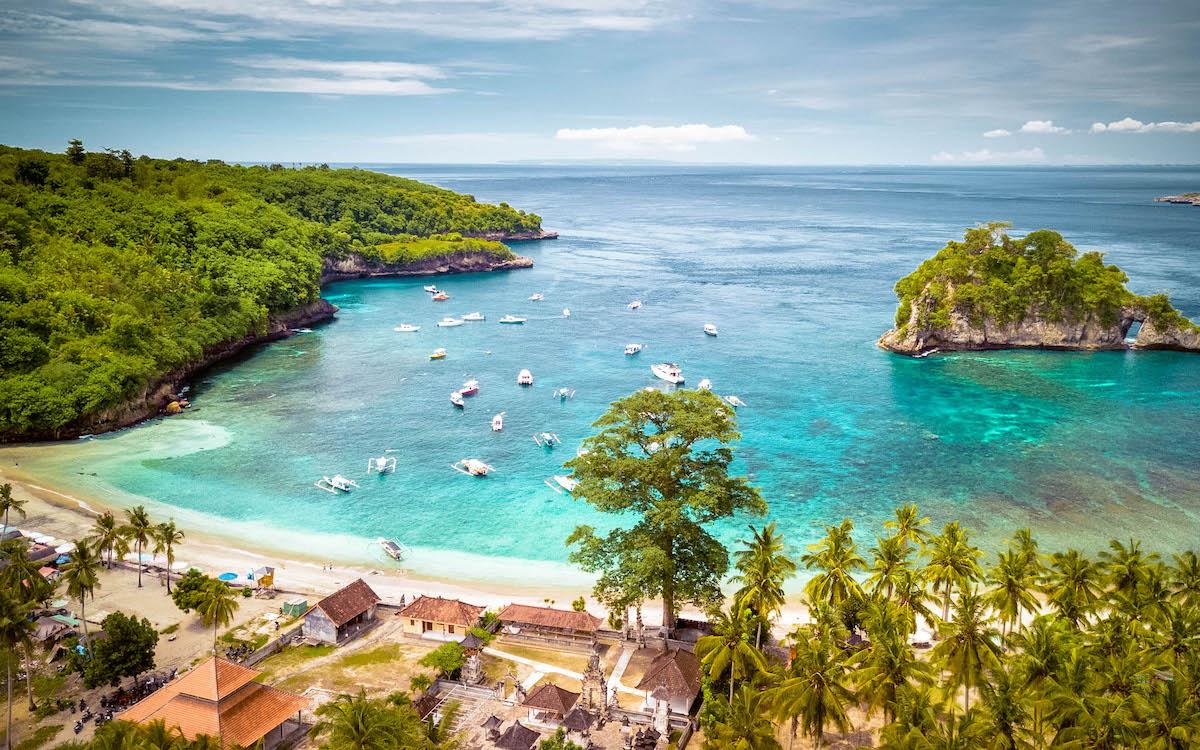
Plage célèbre bordée de palmiers offrant des couchers de soleil balinais spectaculaires et du snorkeling.

Famous beachside bar known for live music, sunset views, and signature cocktails.

Popular day club featuring a large pool, relaxed atmosphere, and international DJ sets.
Premium beach club near Toyapakeh harbor with direct beach access and luxury daybeds.
Iconic sunset destination offering panoramic ocean views and private bamboo nests.