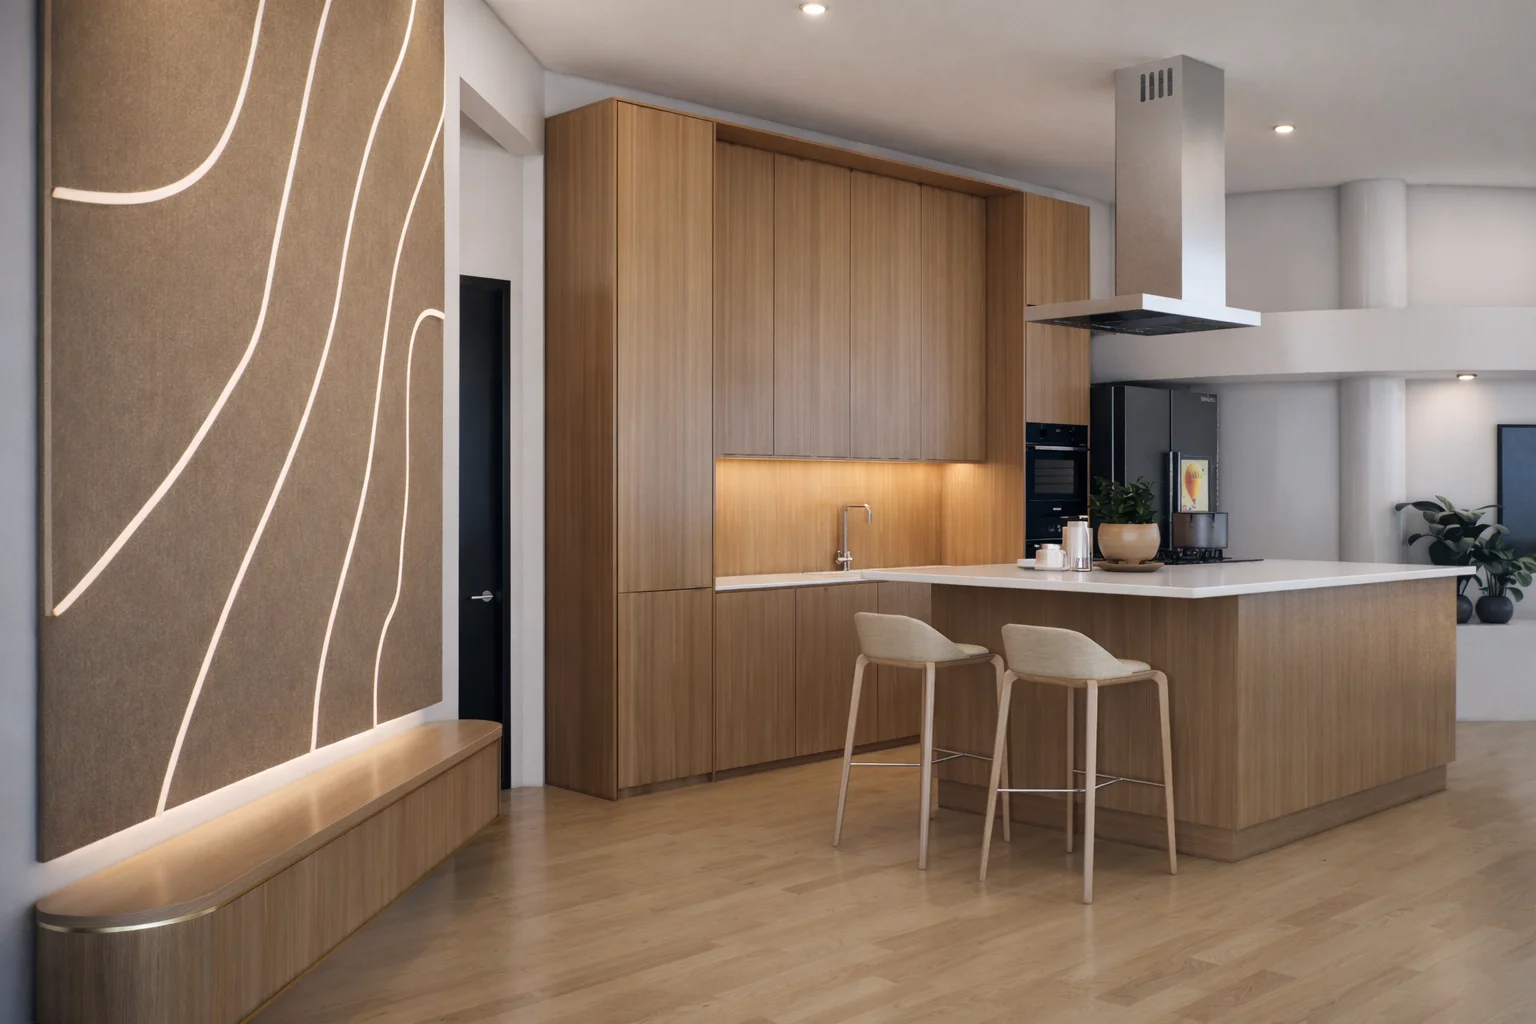
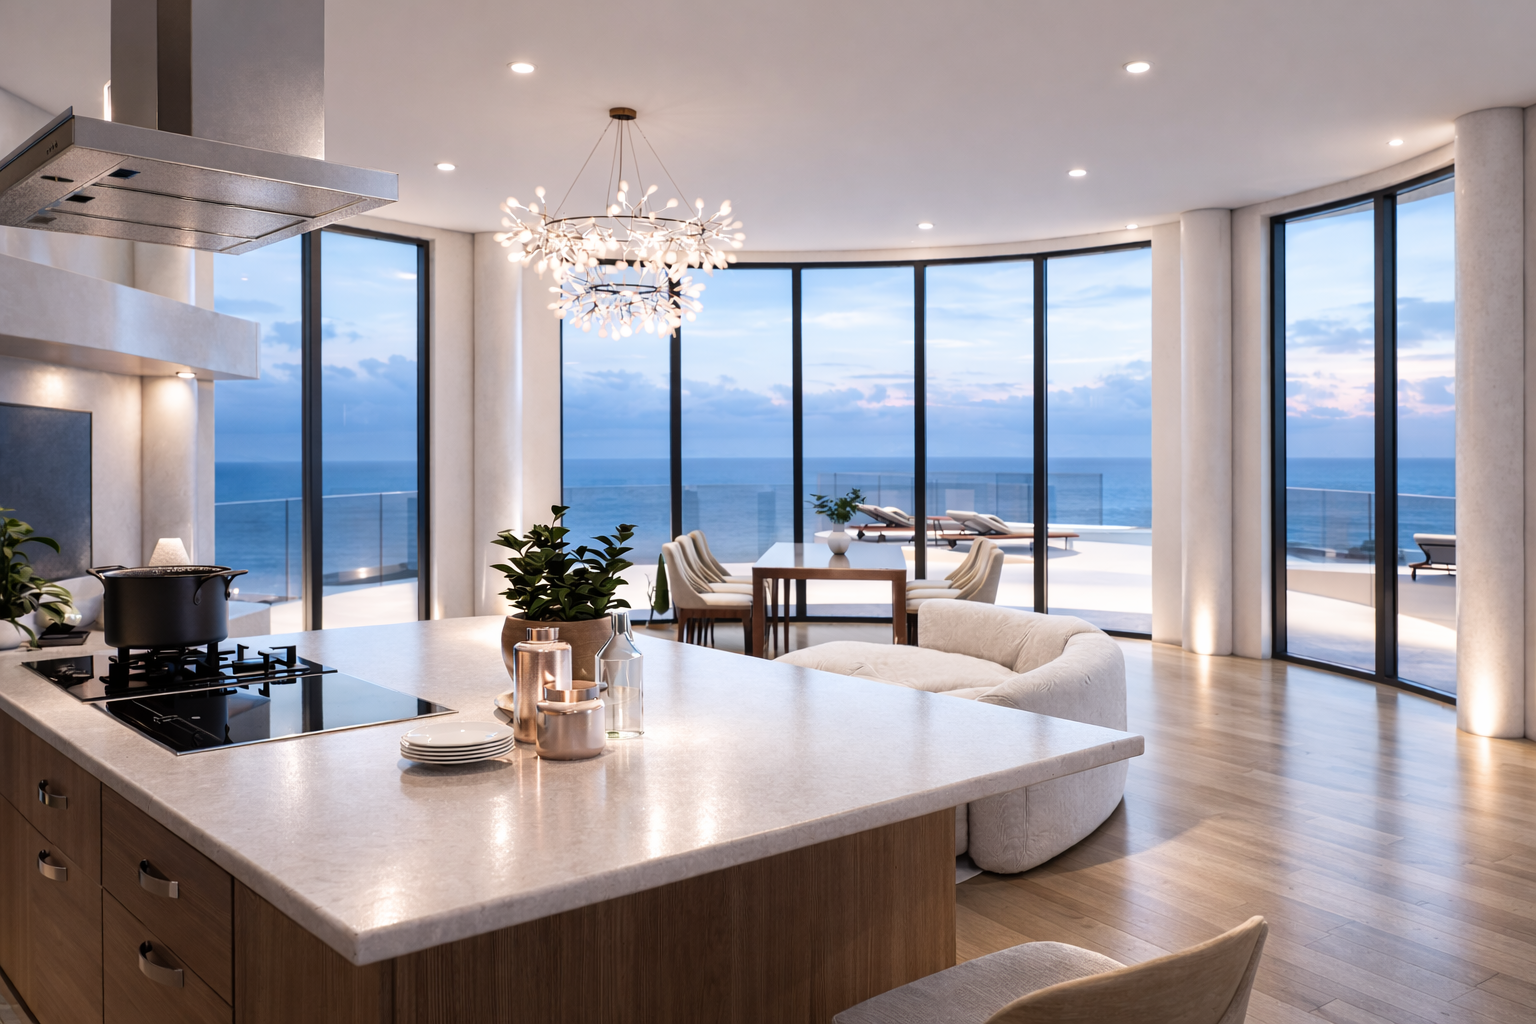
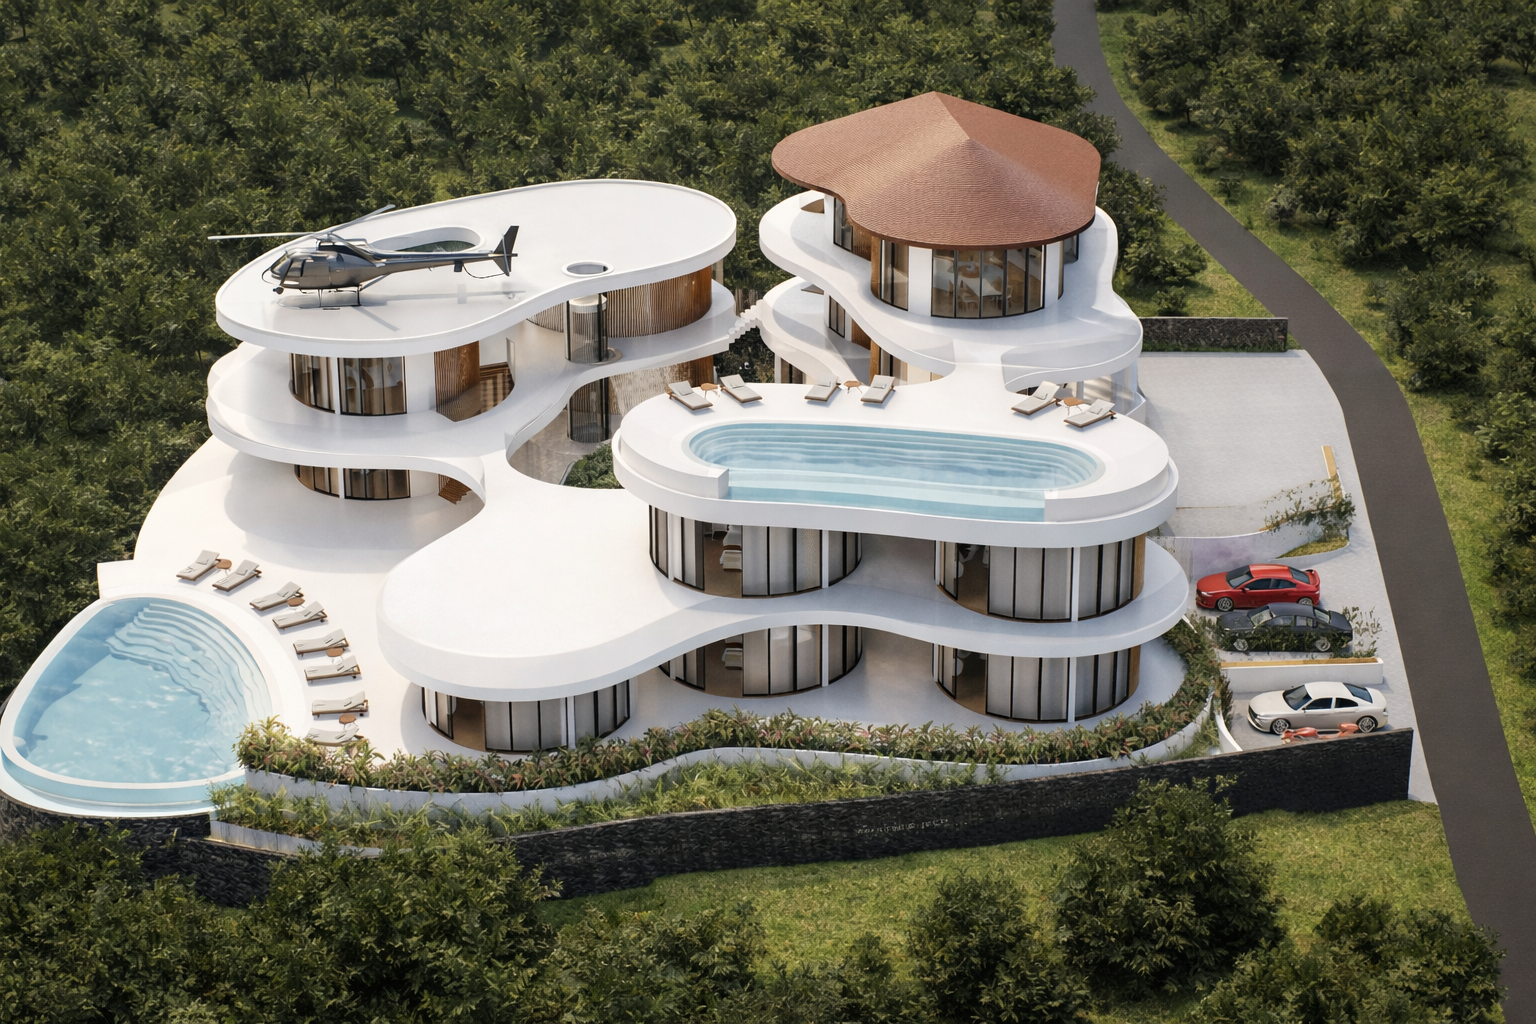
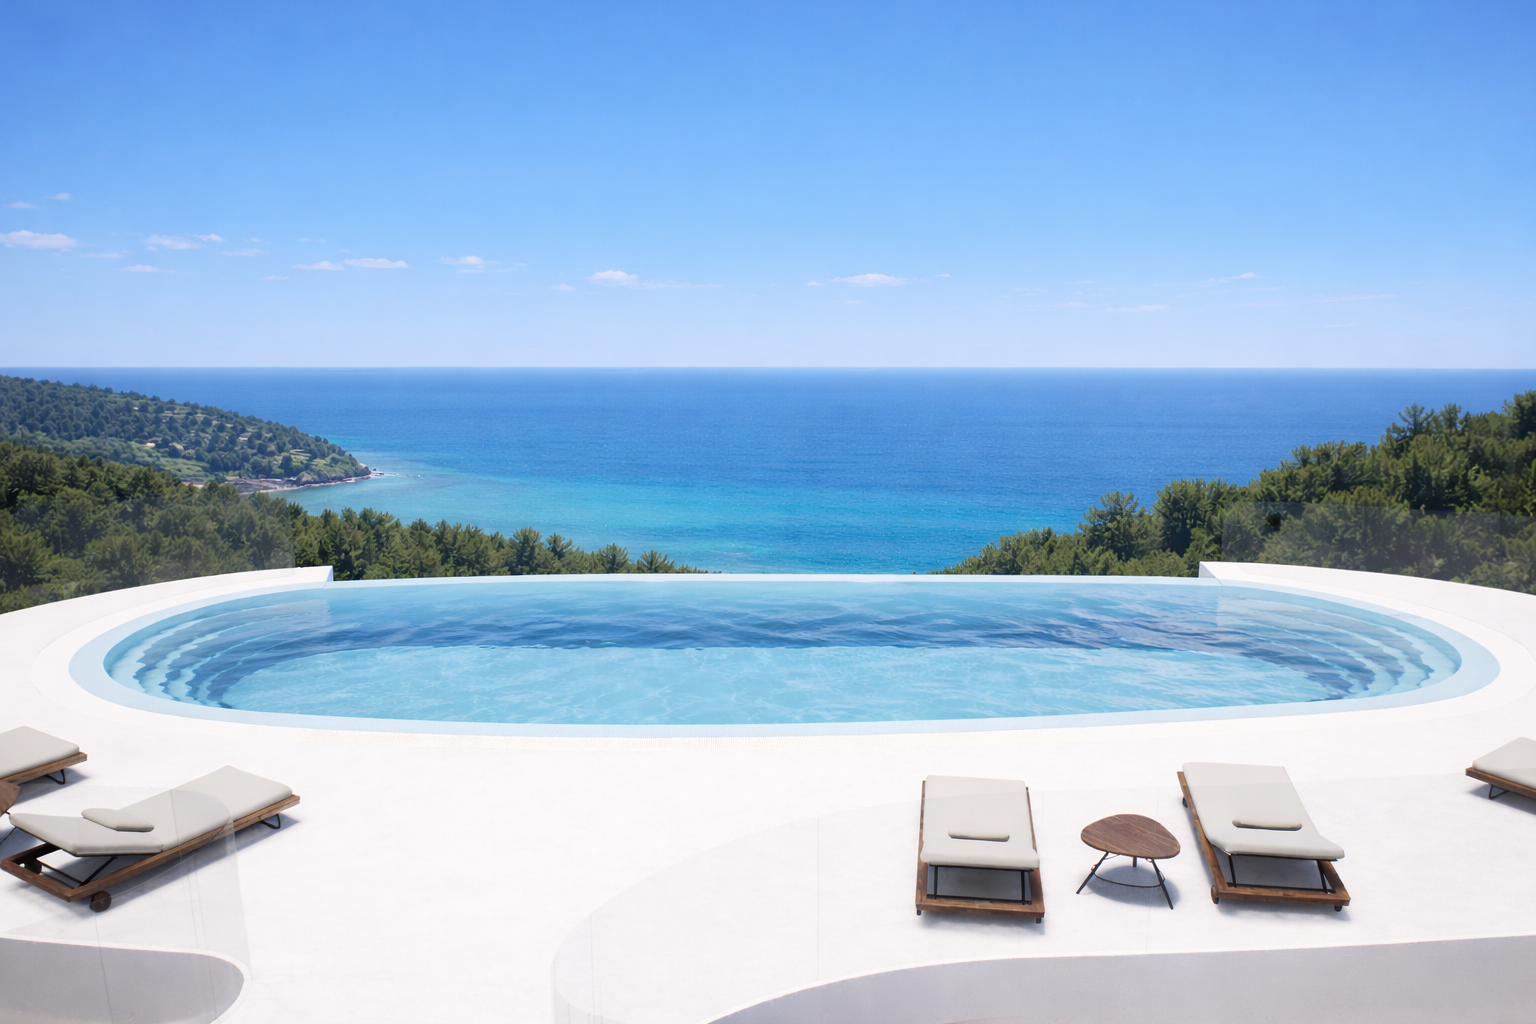
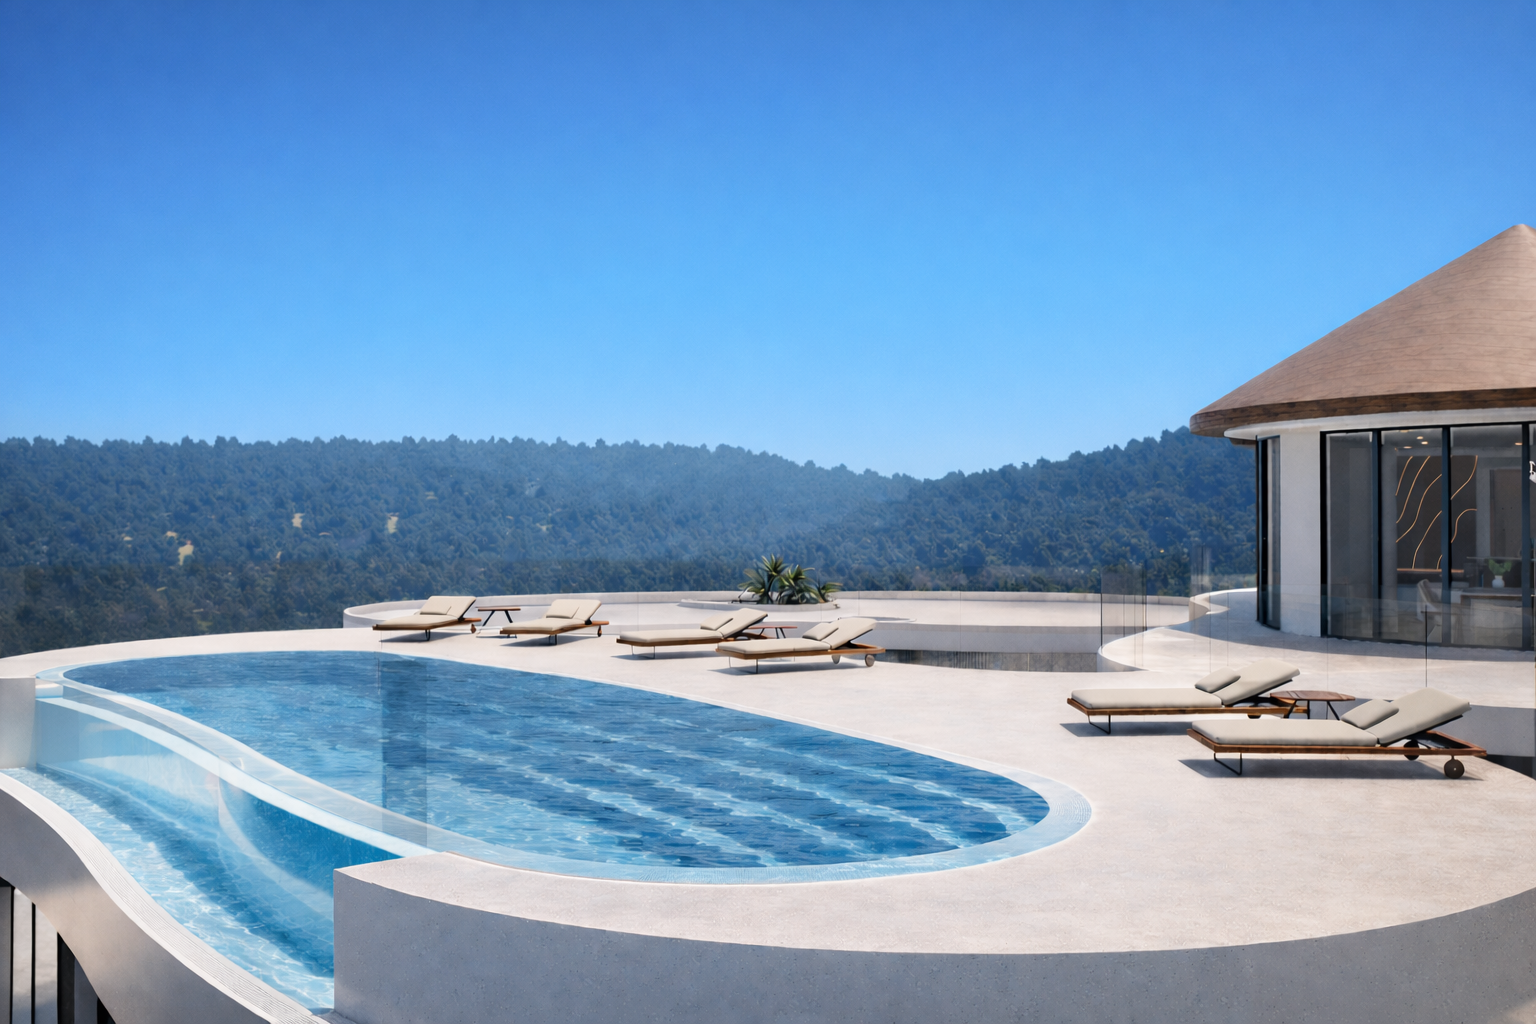
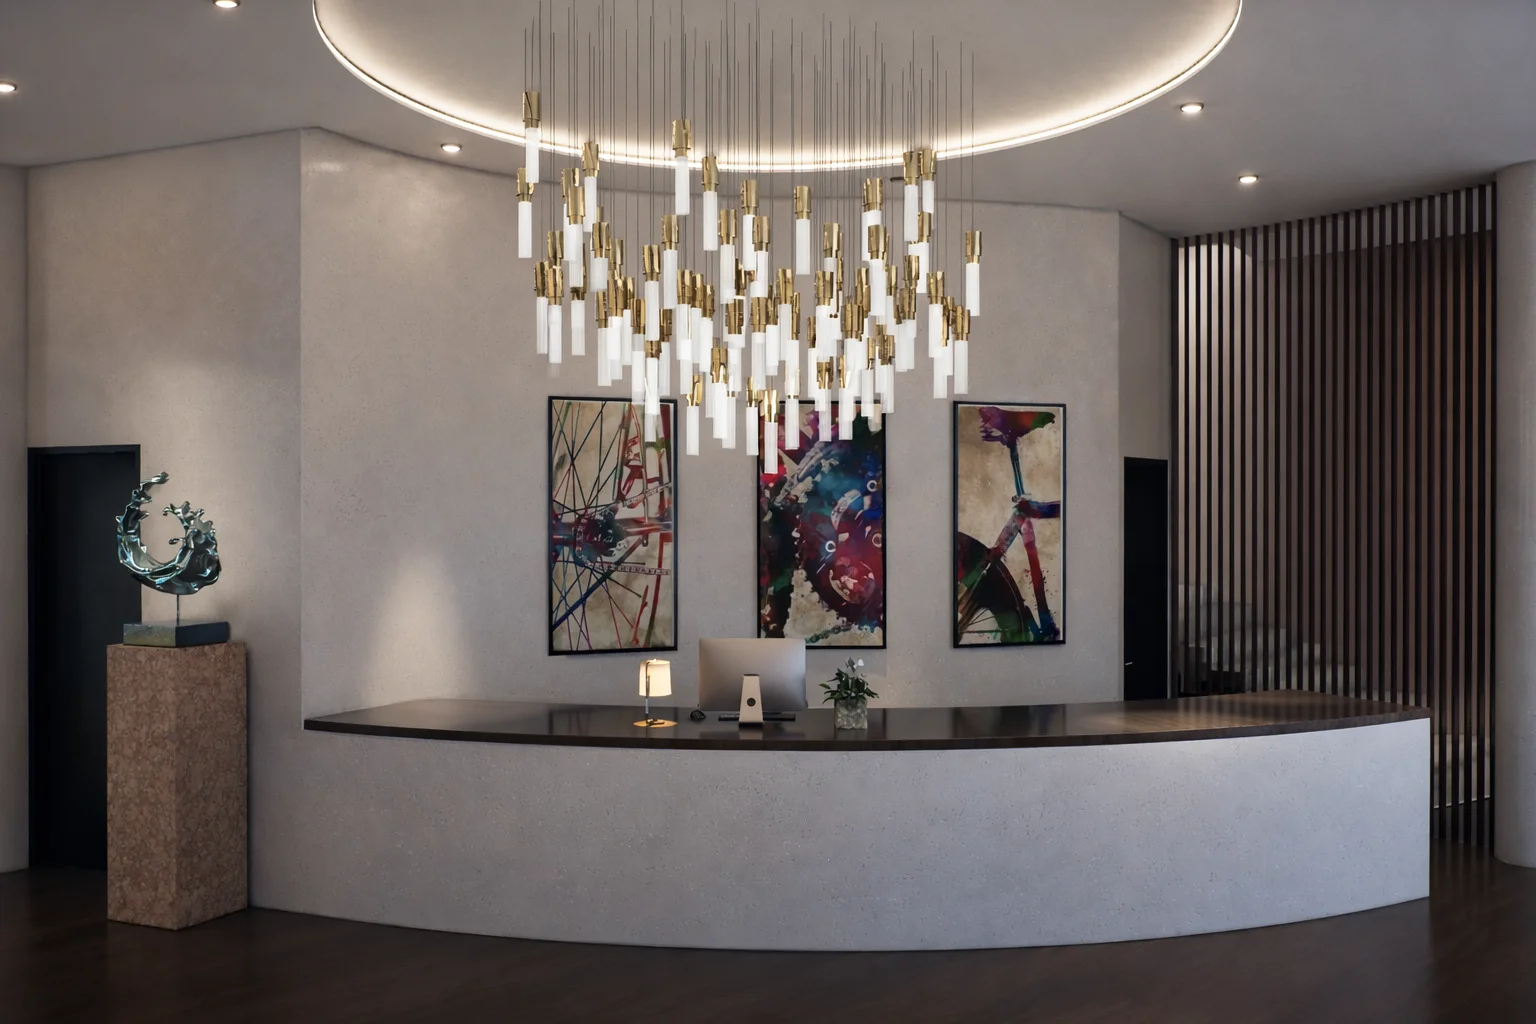
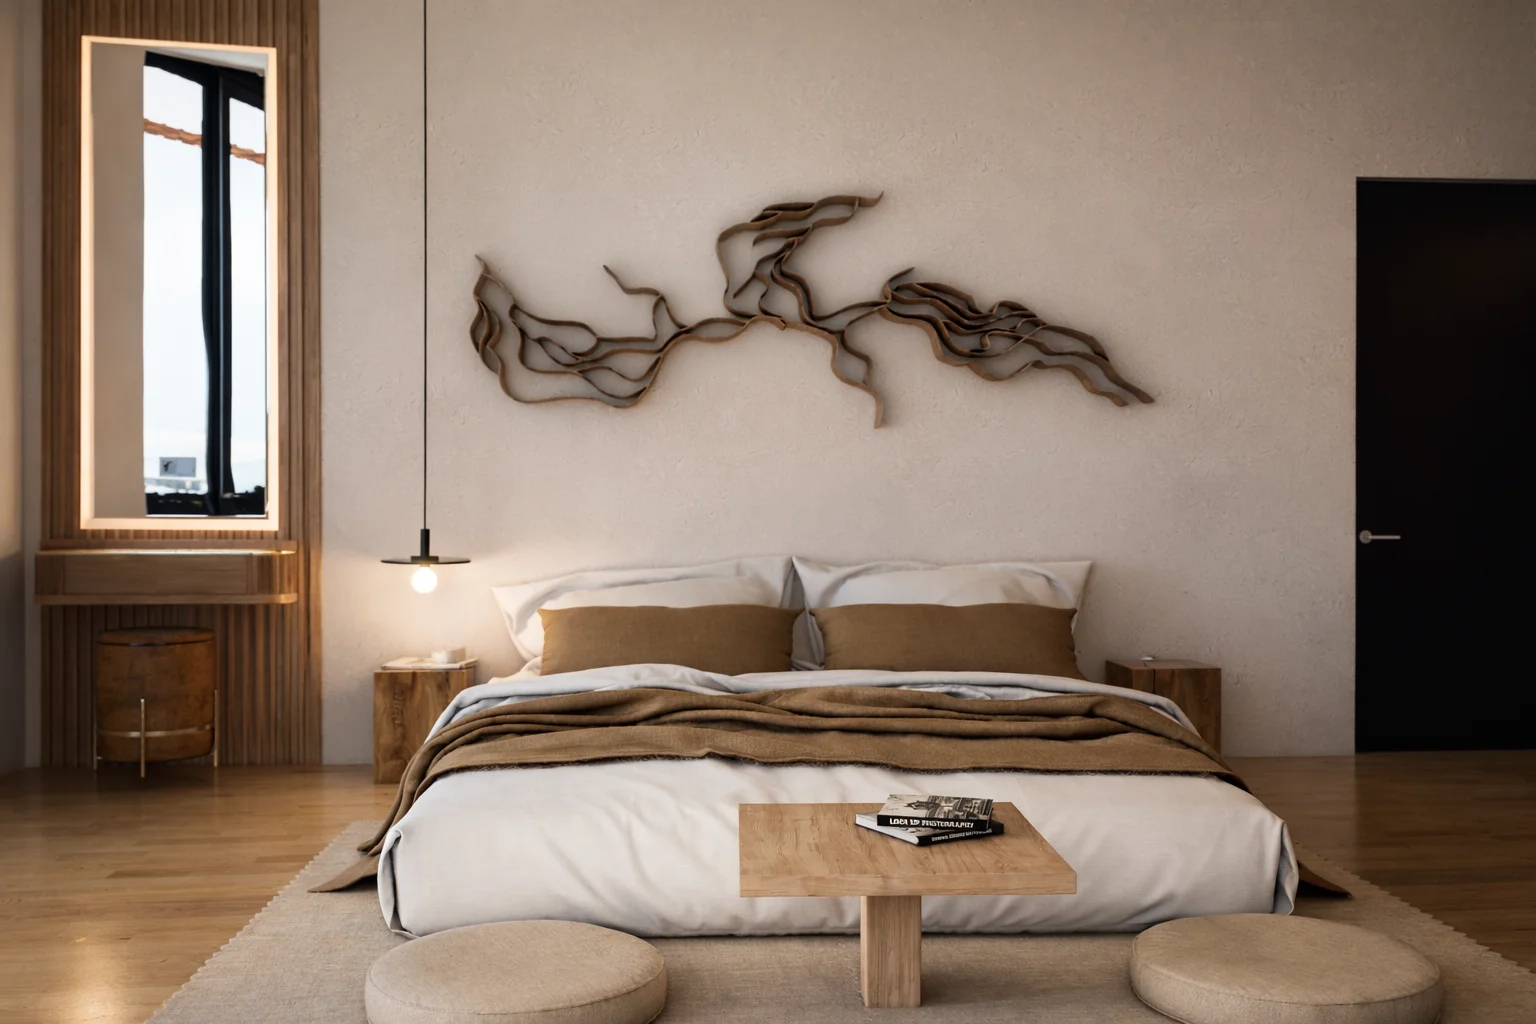
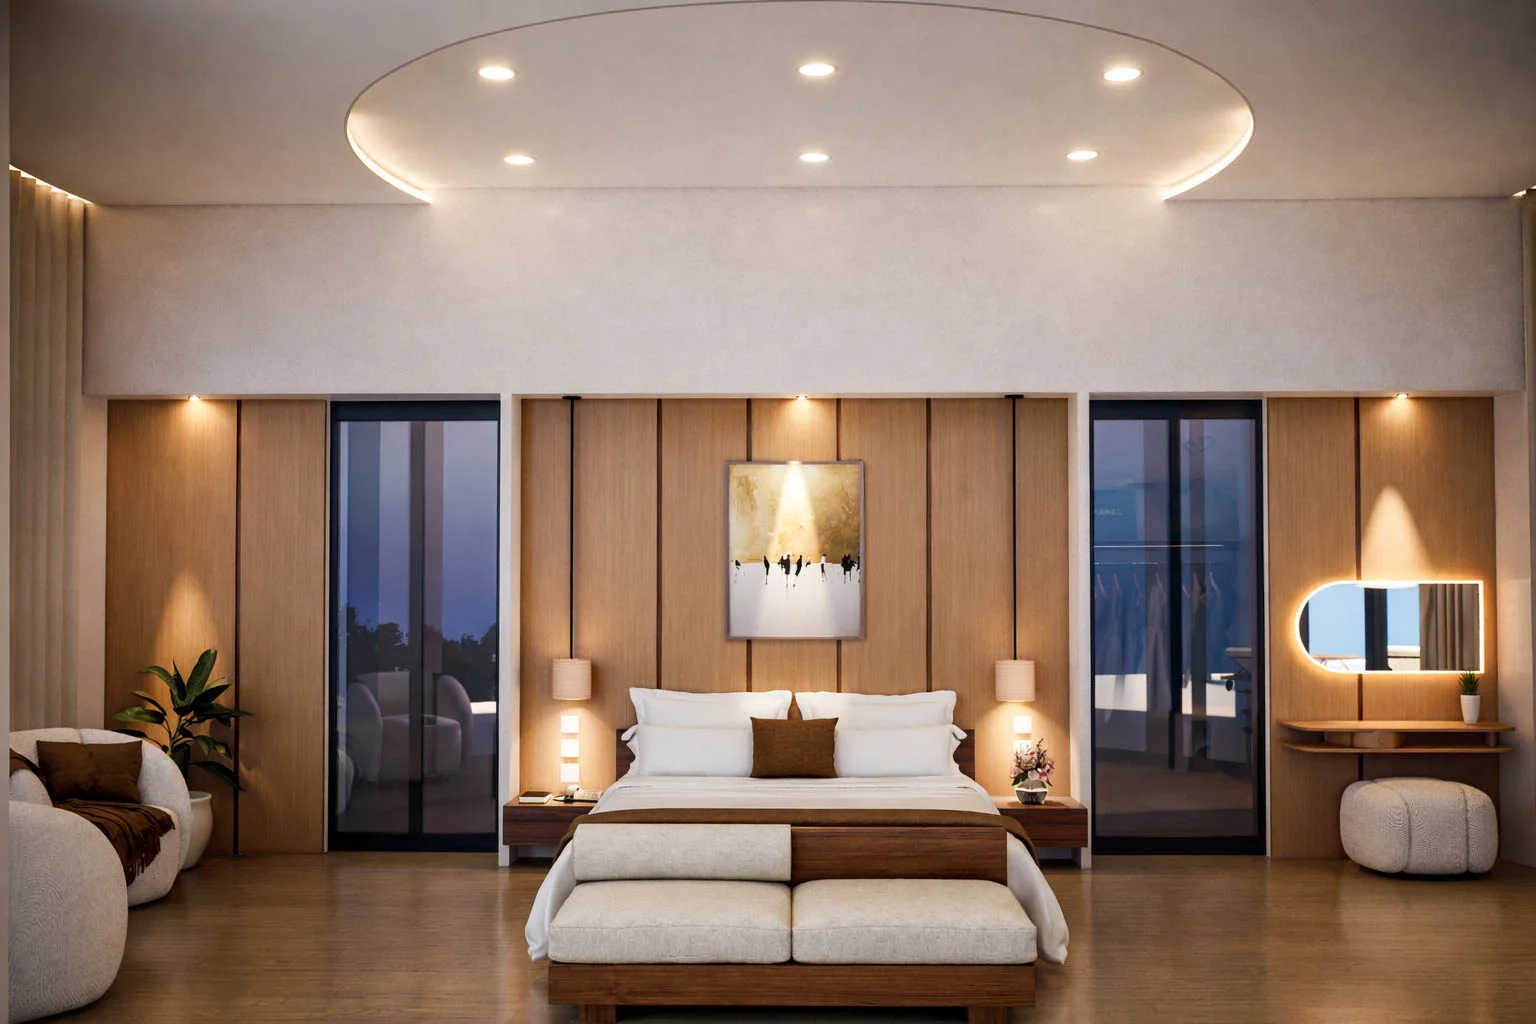
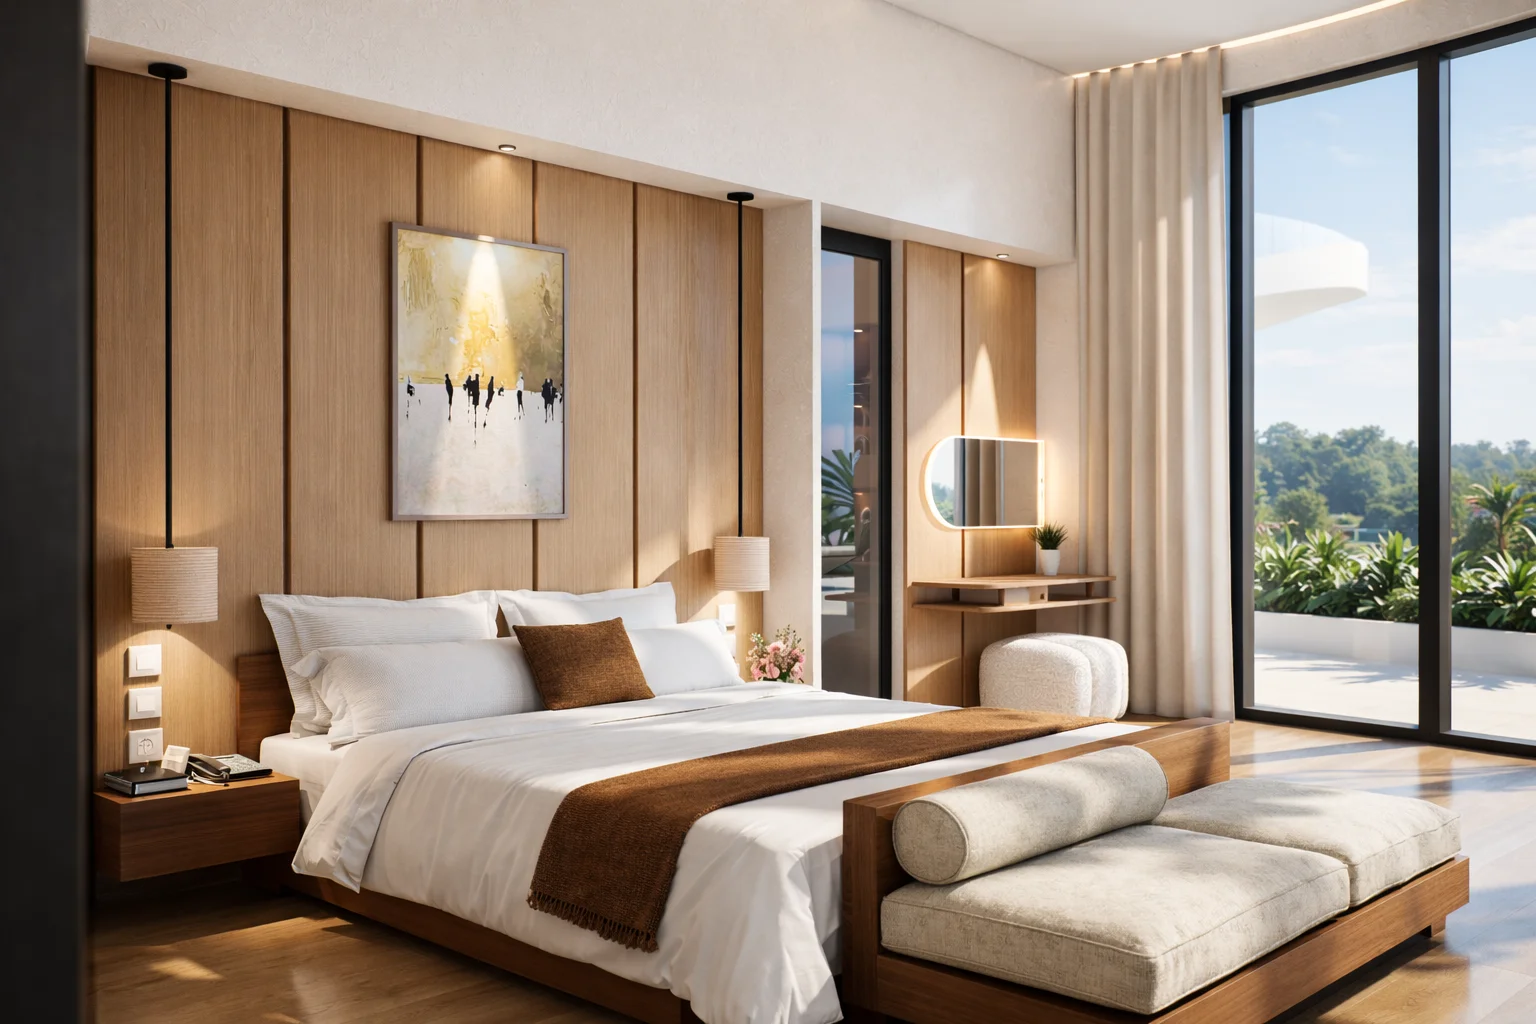
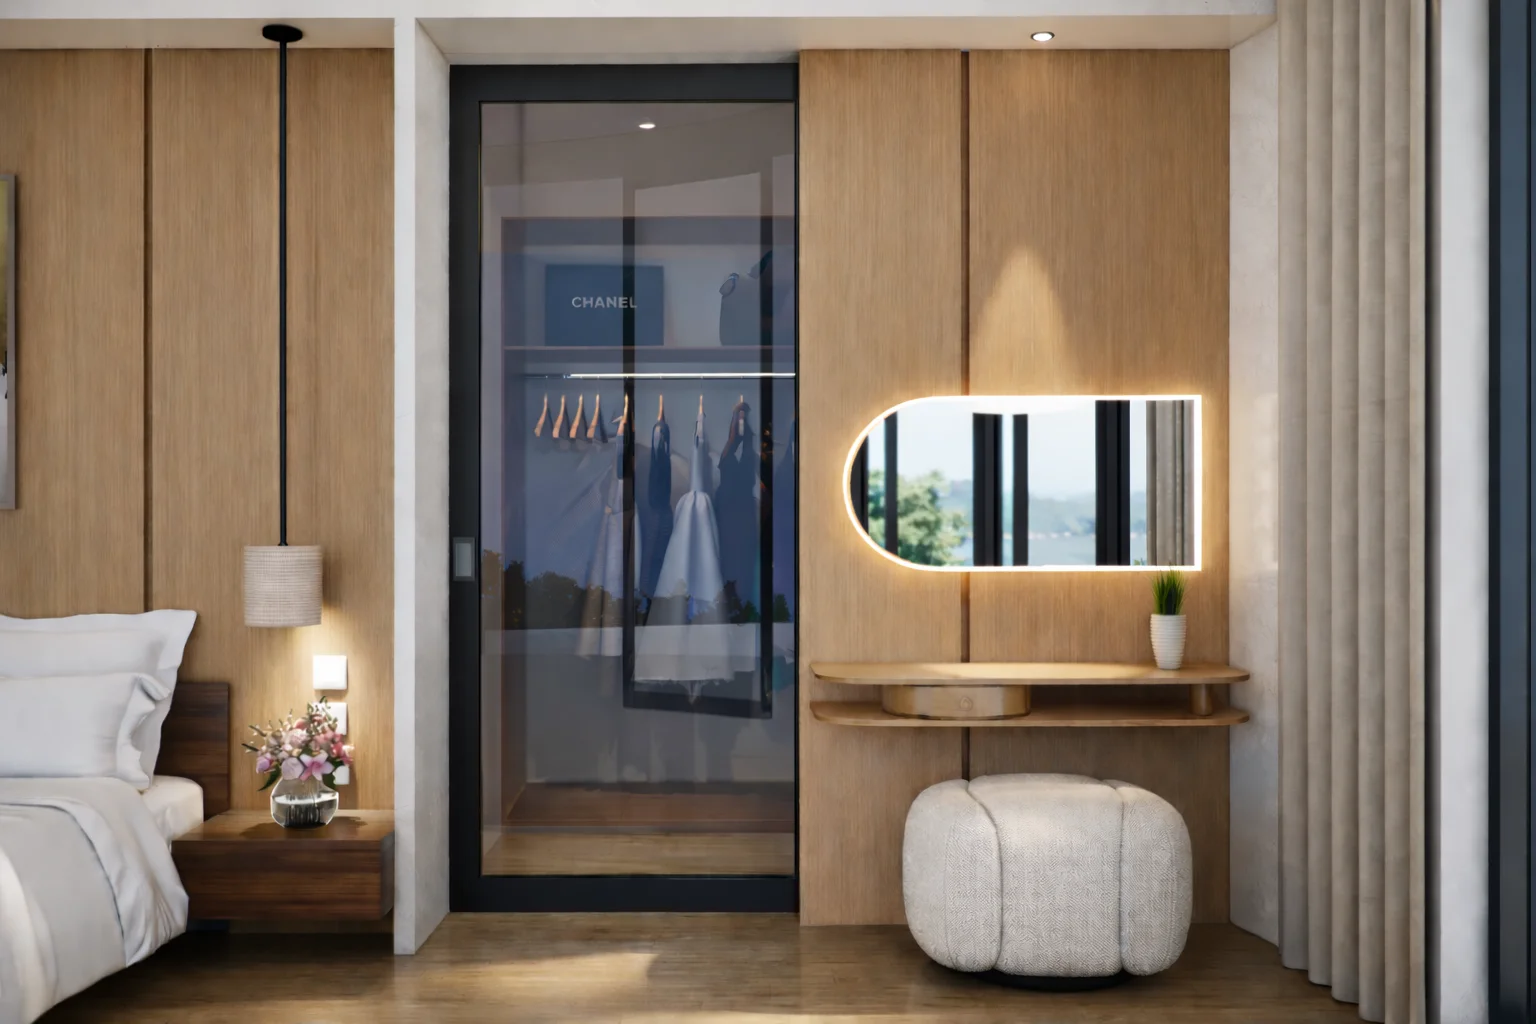
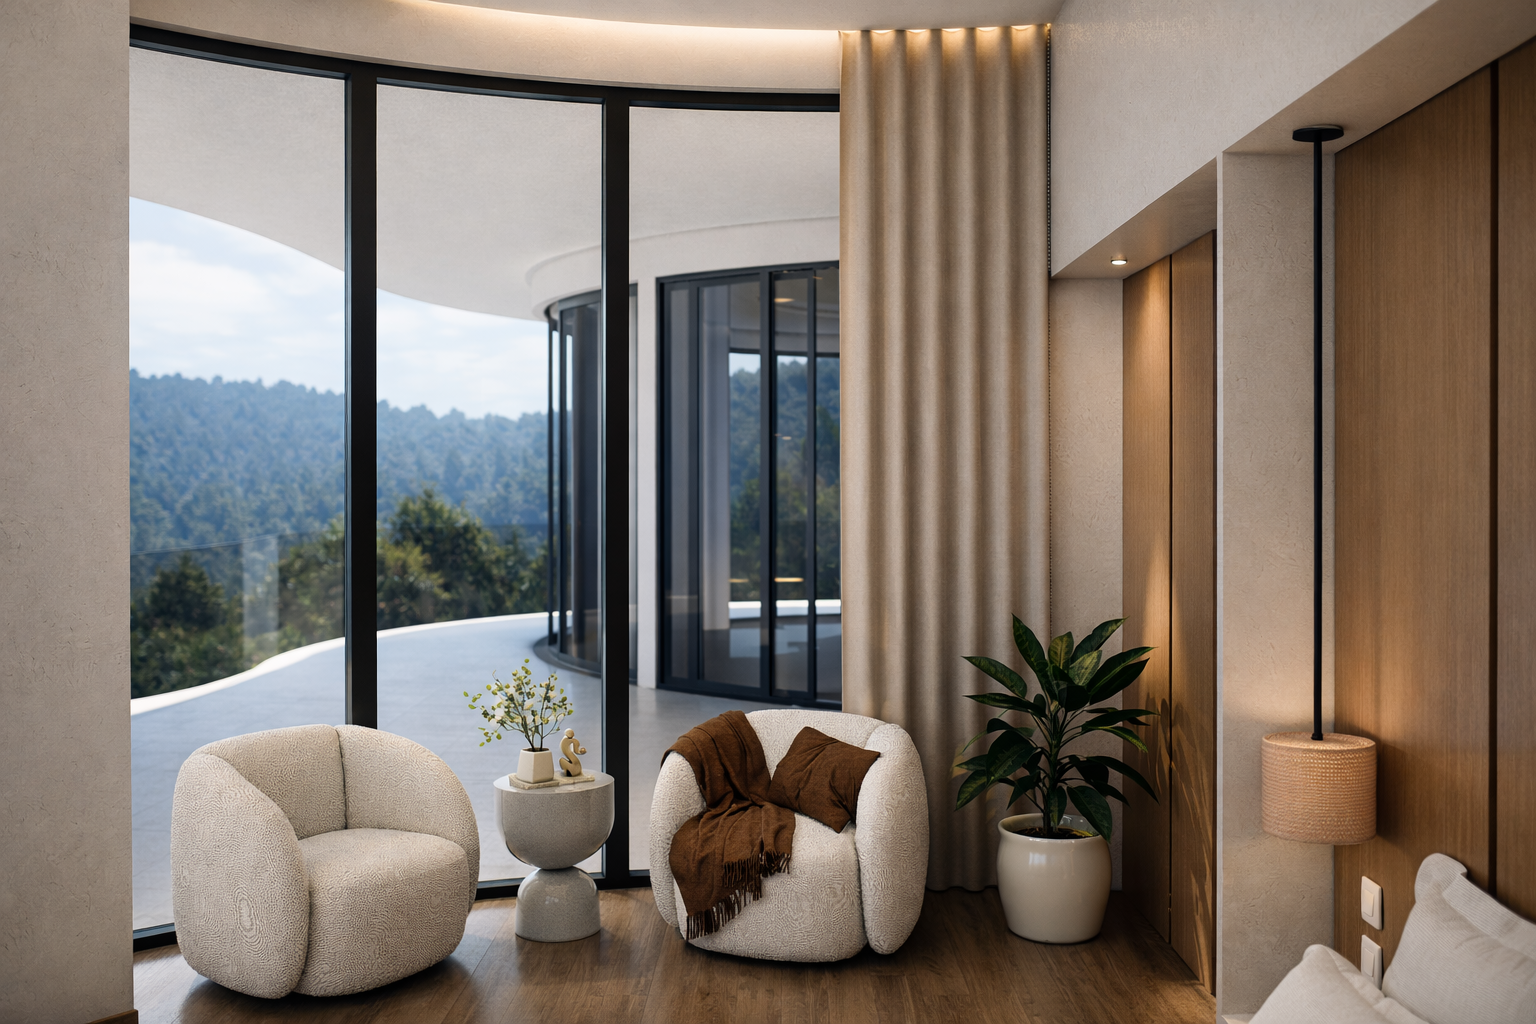
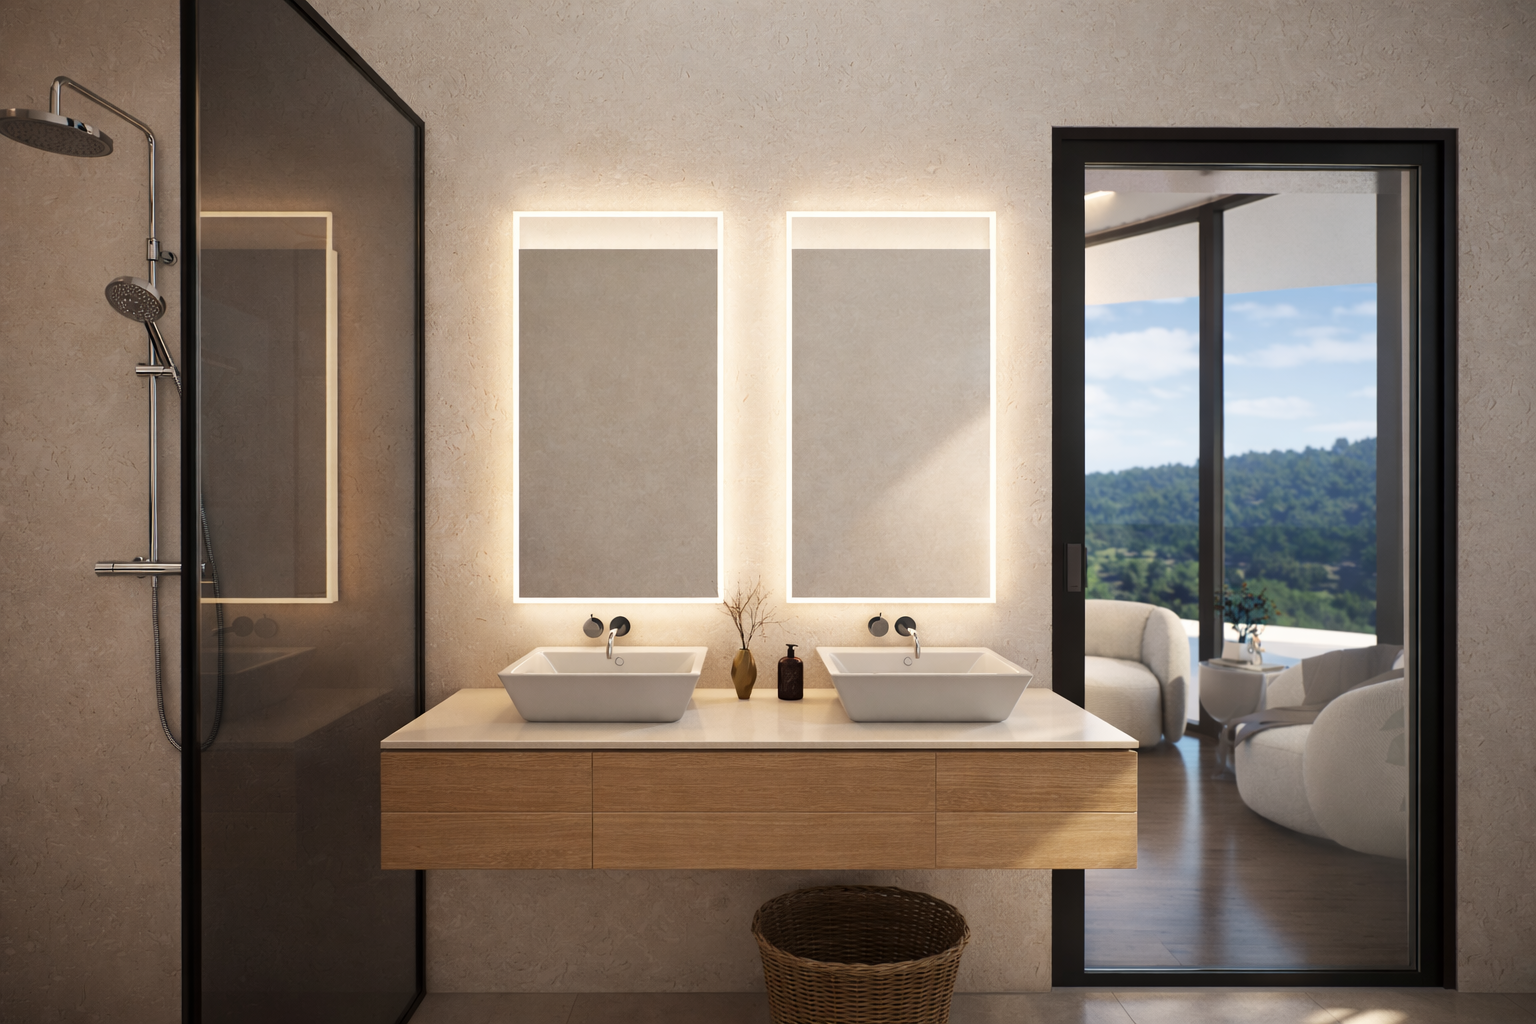
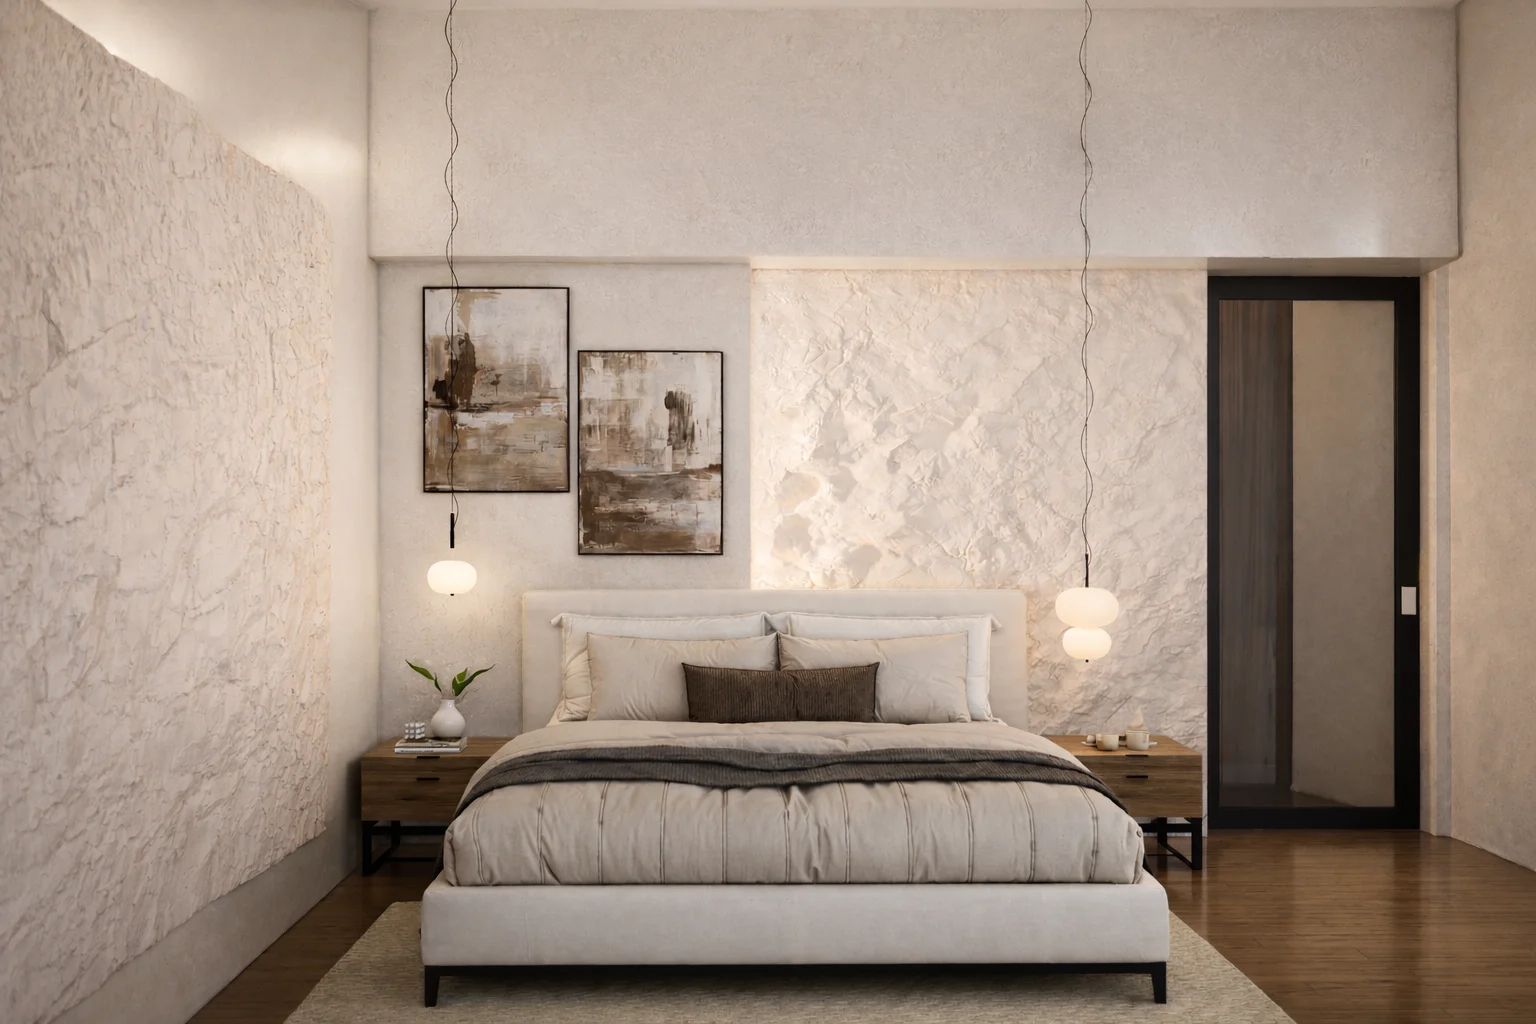
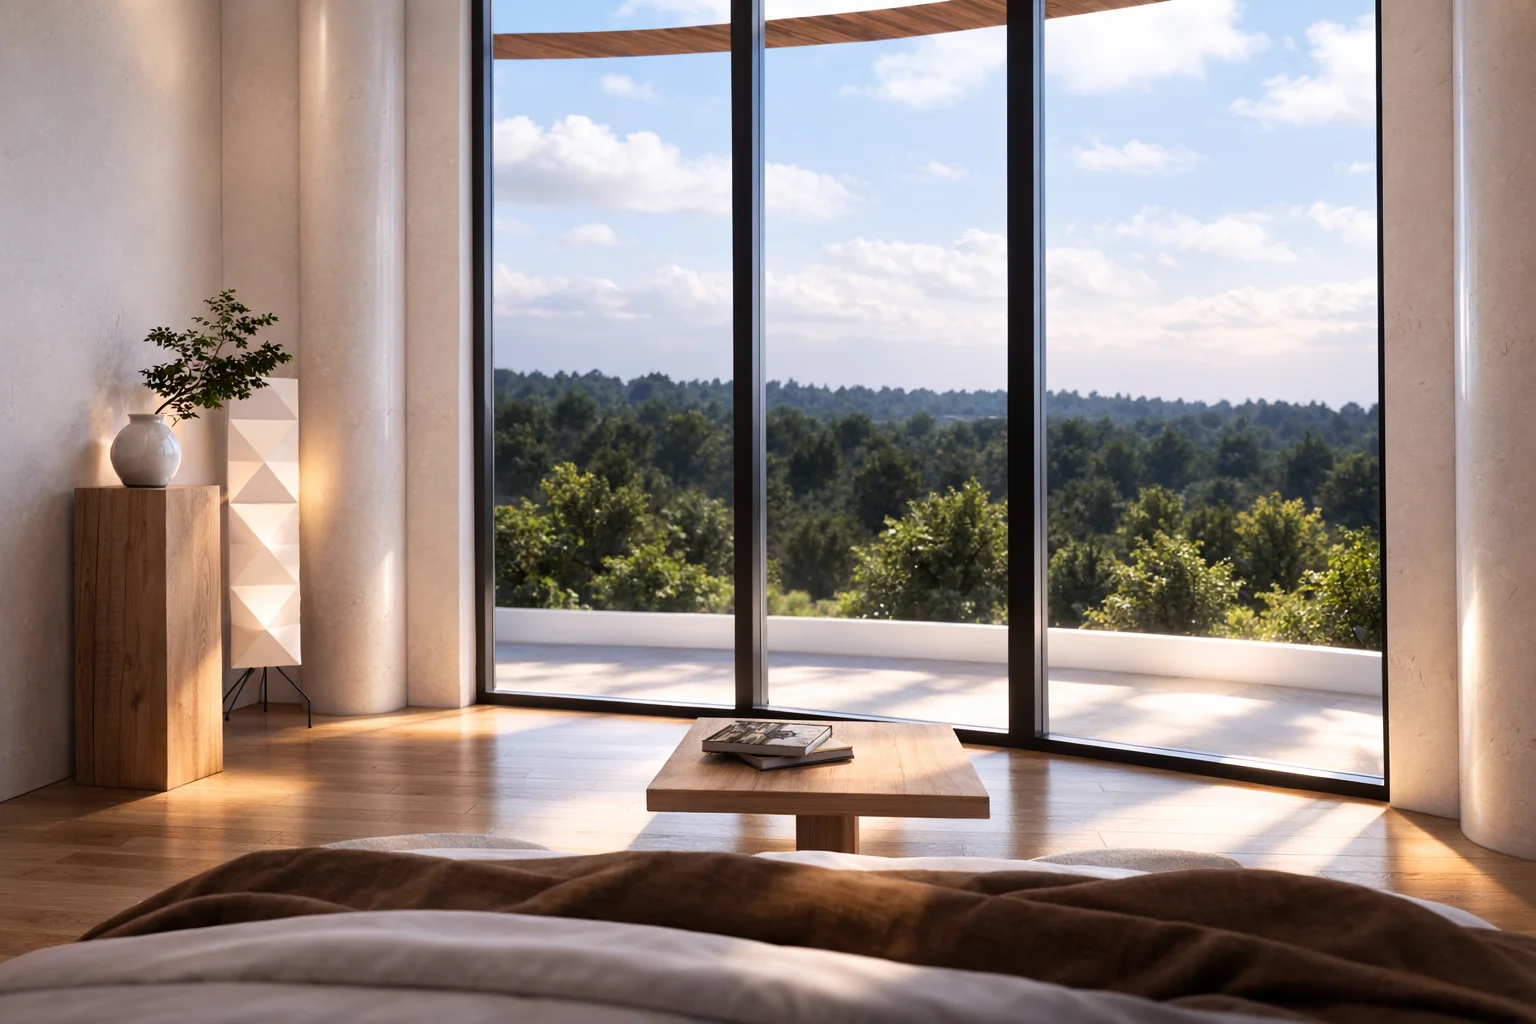
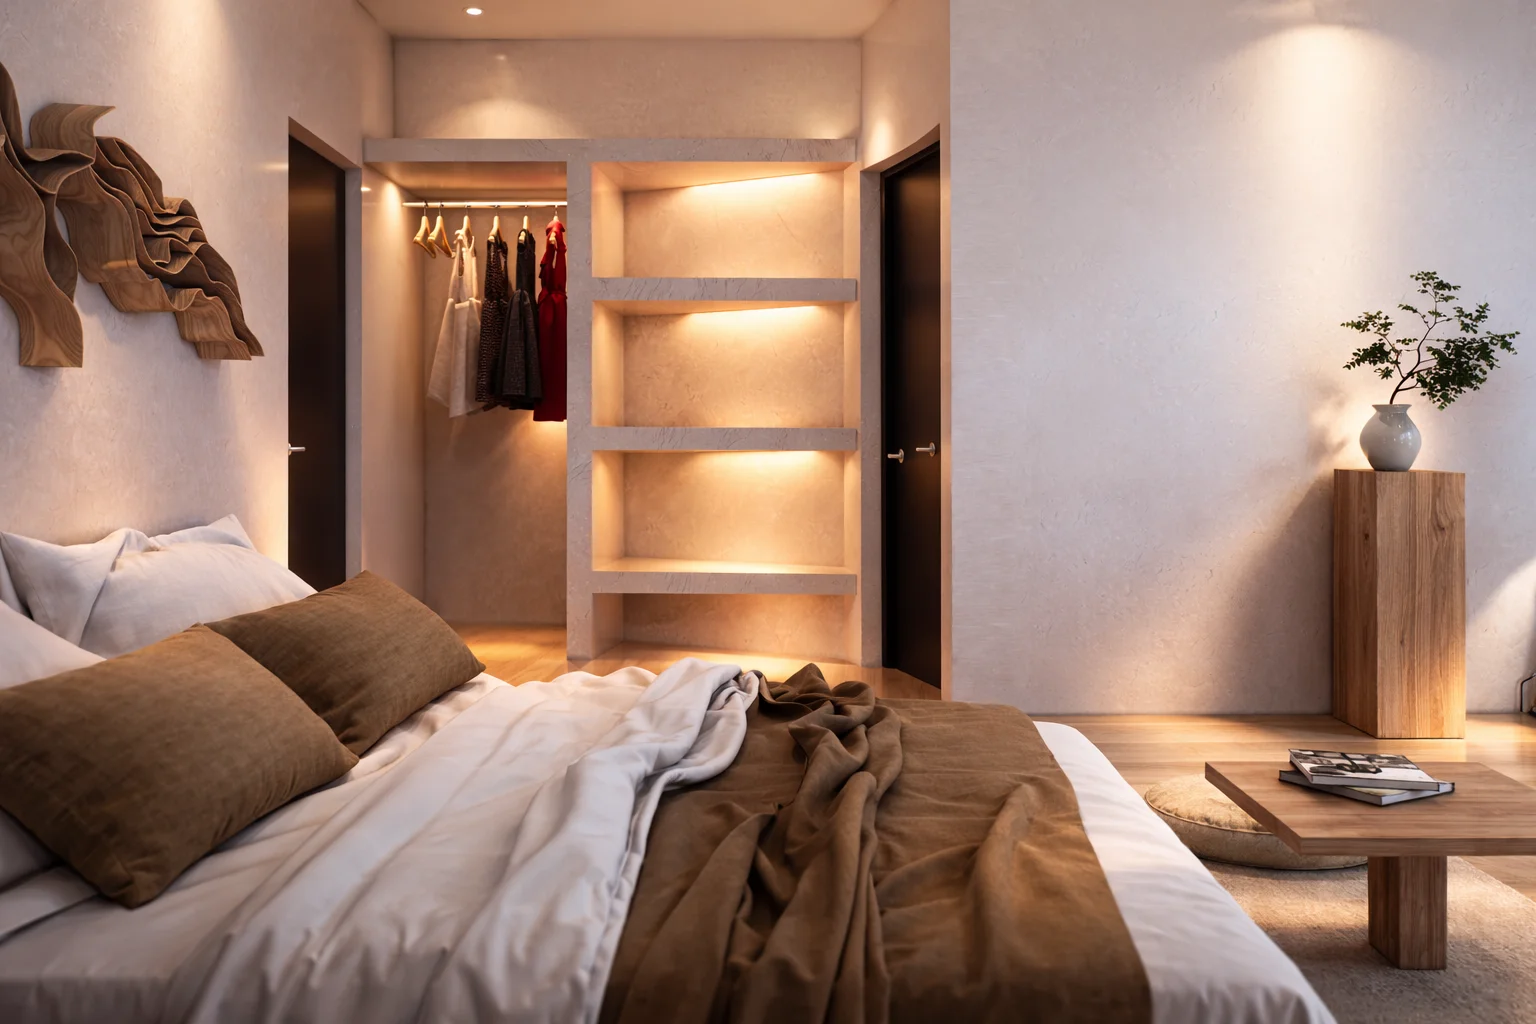
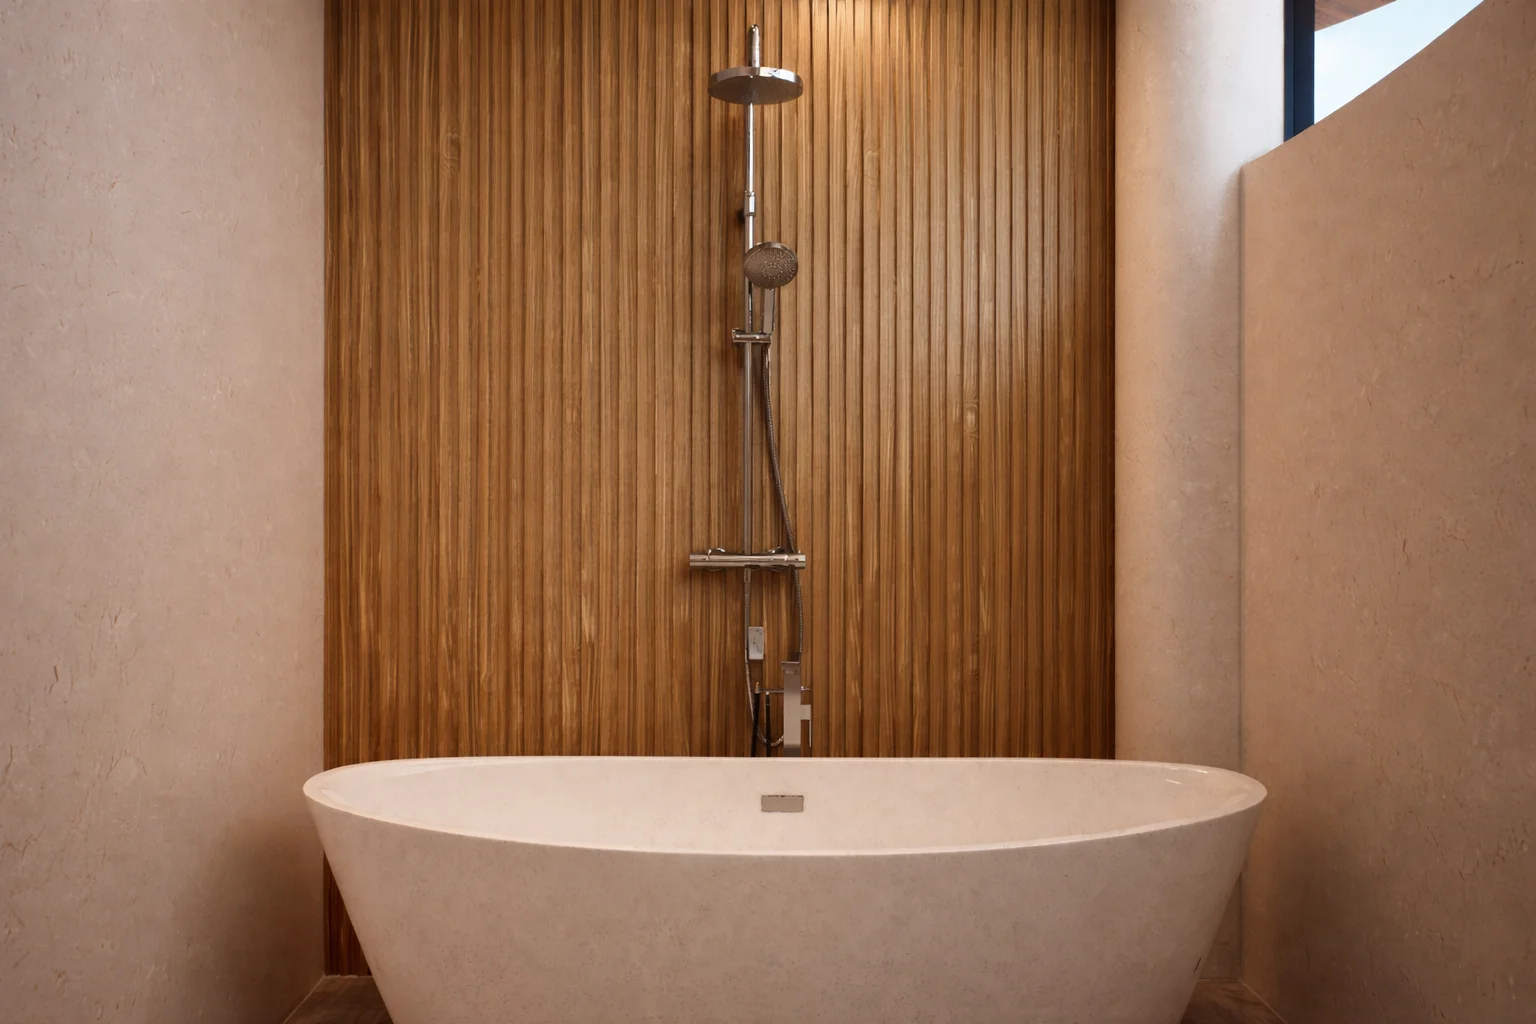
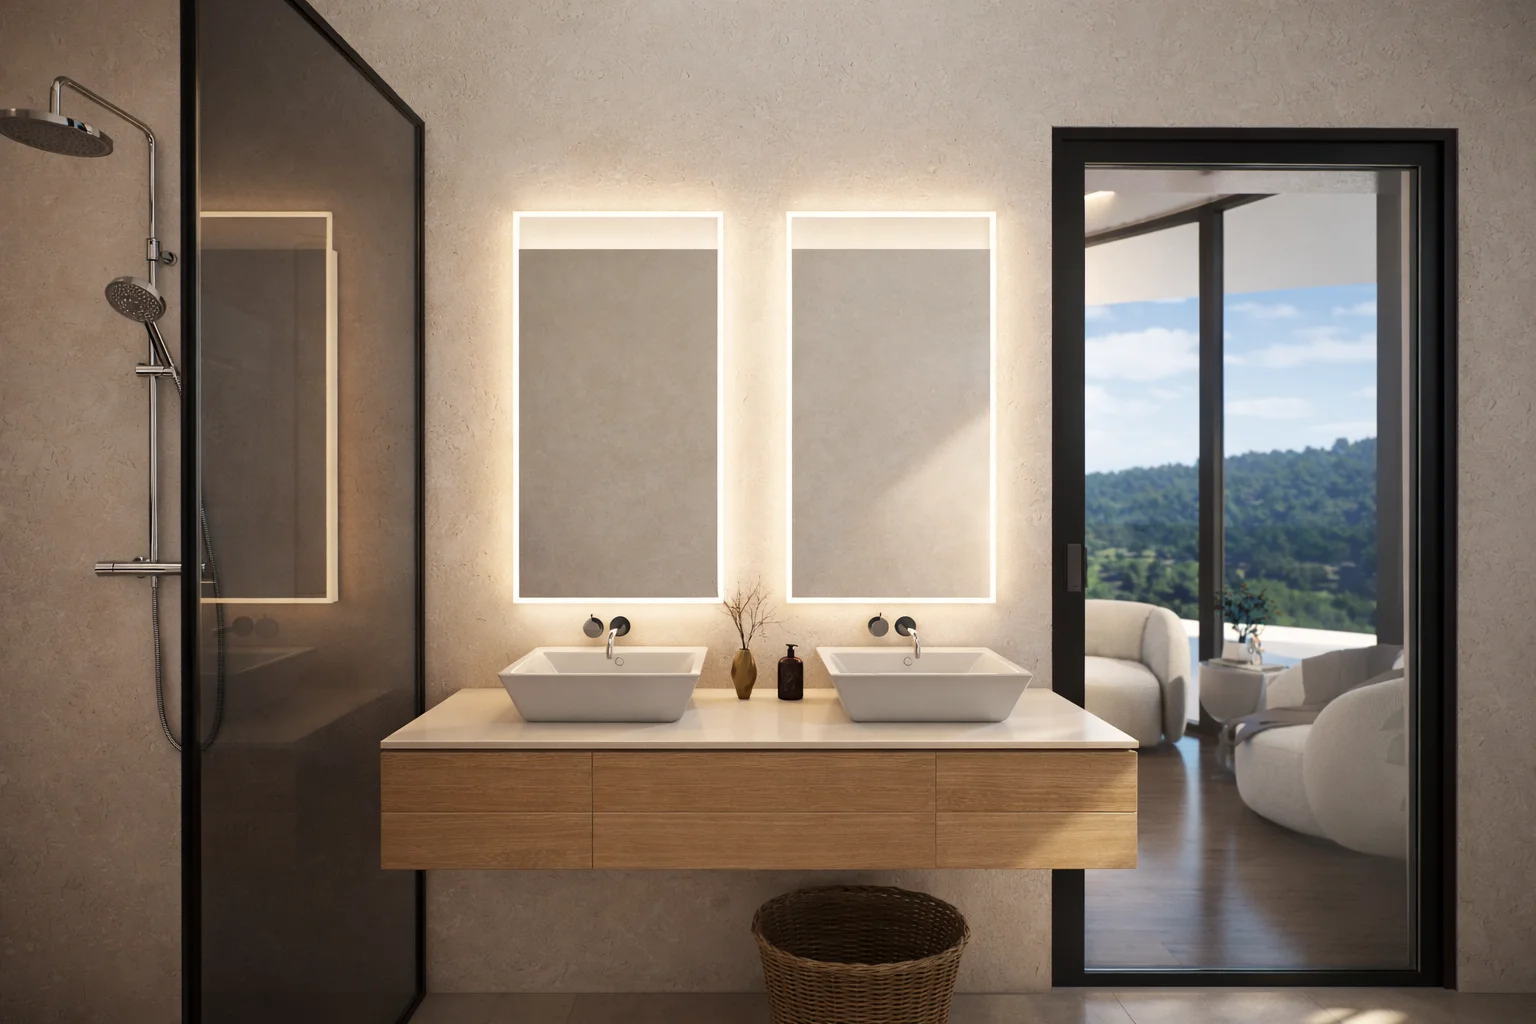
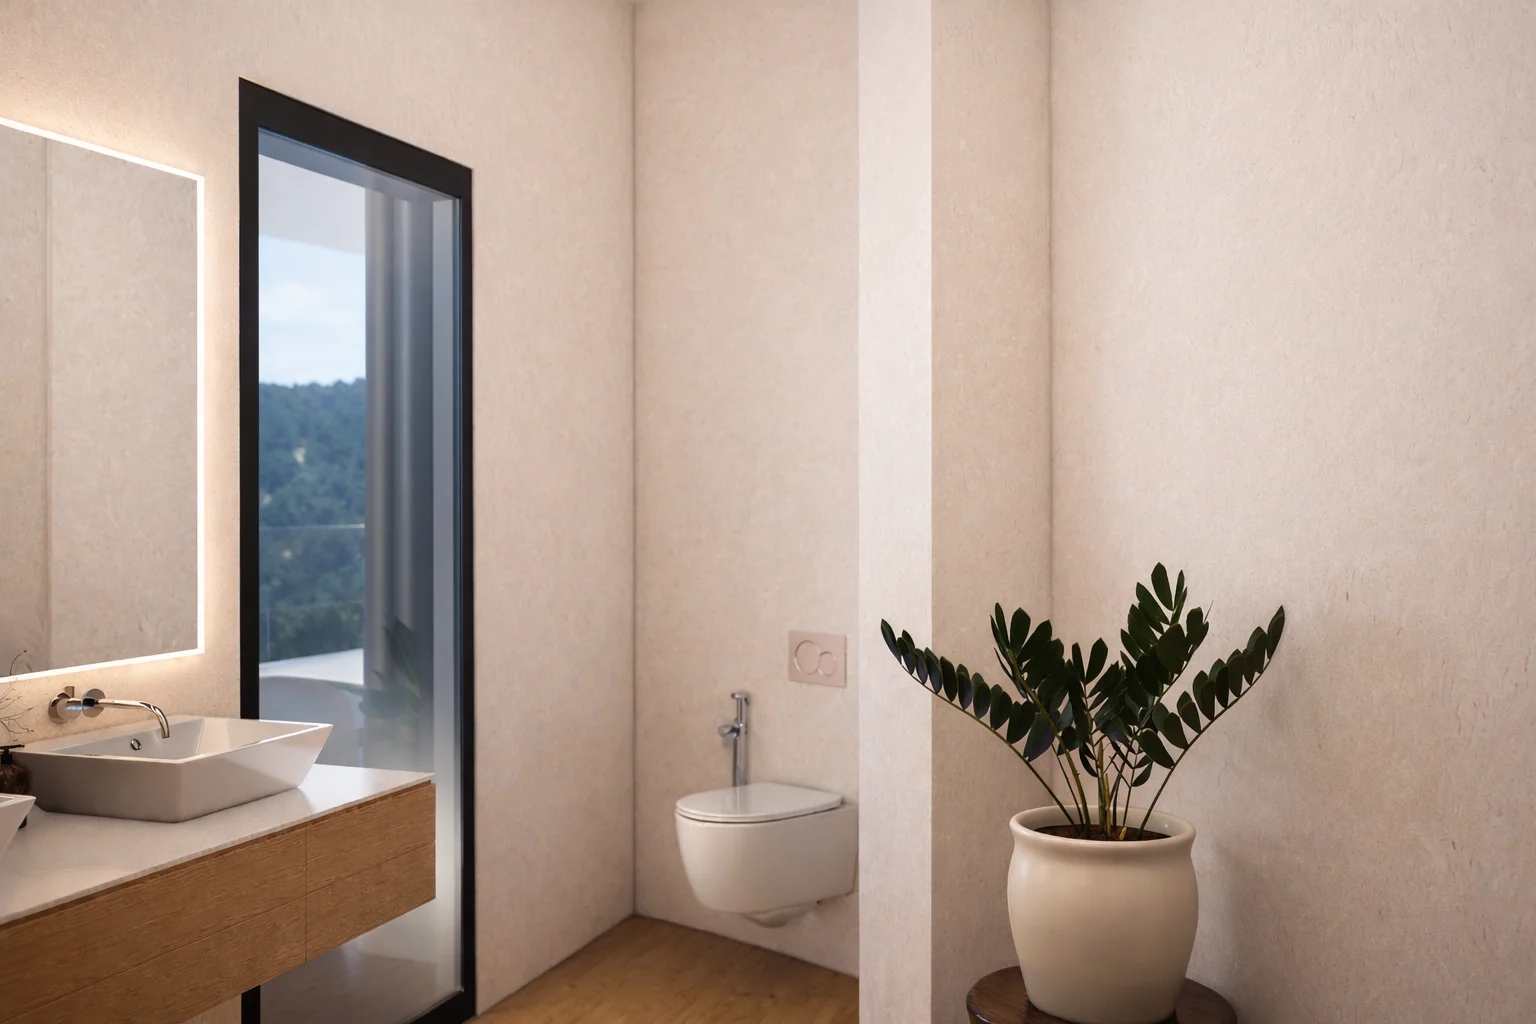
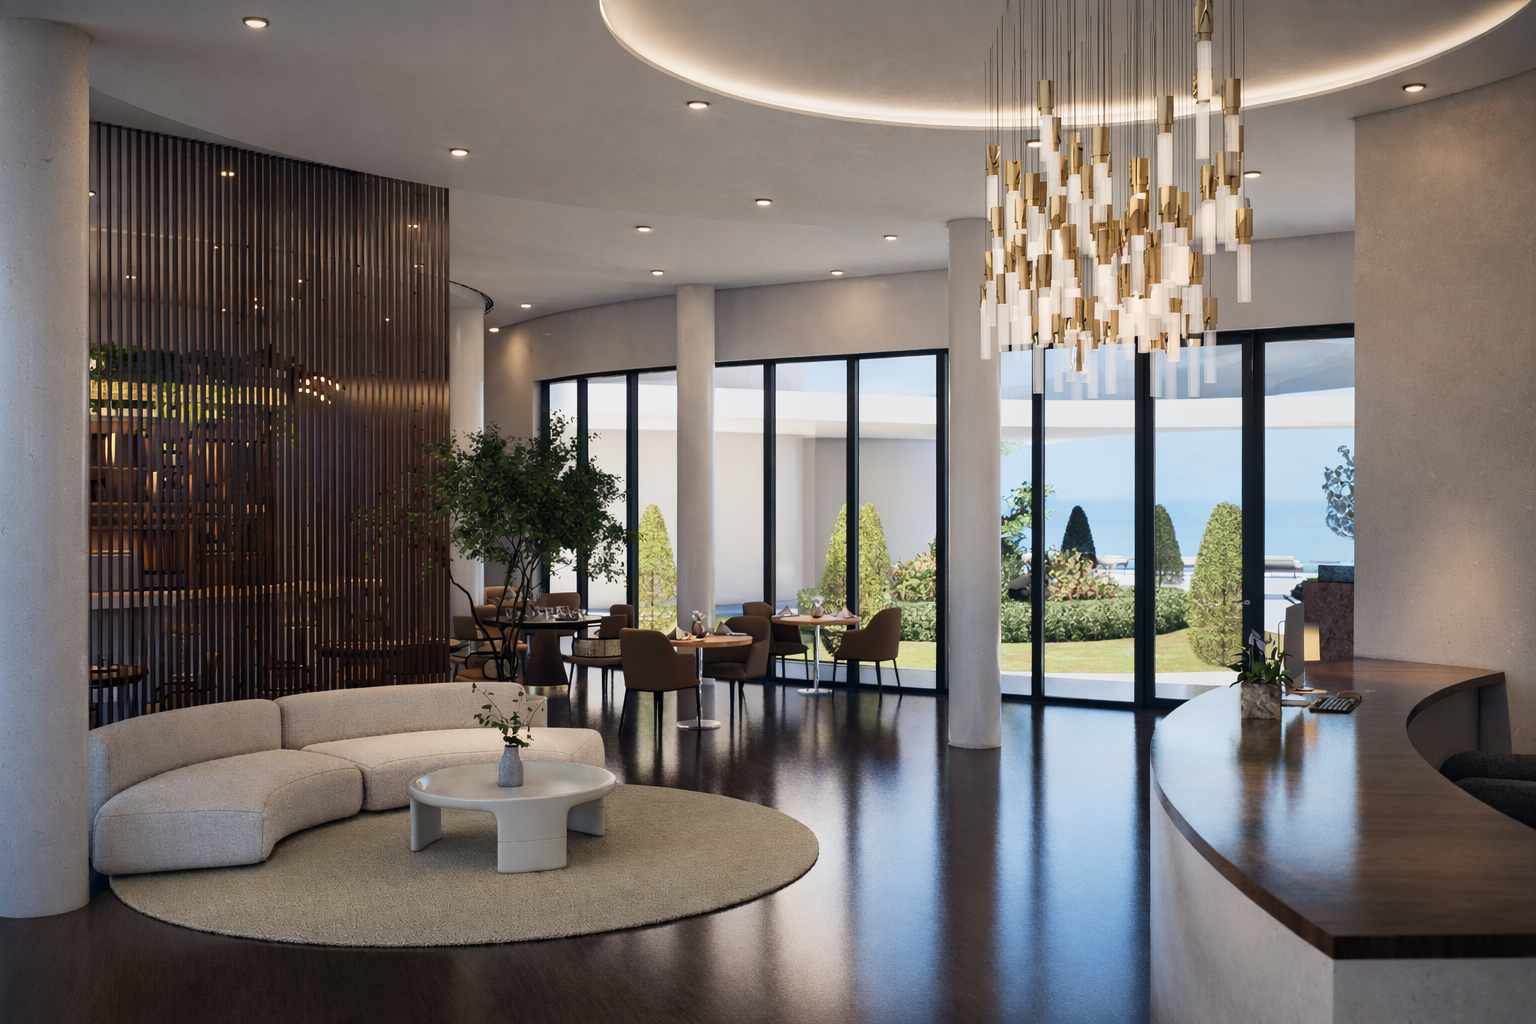
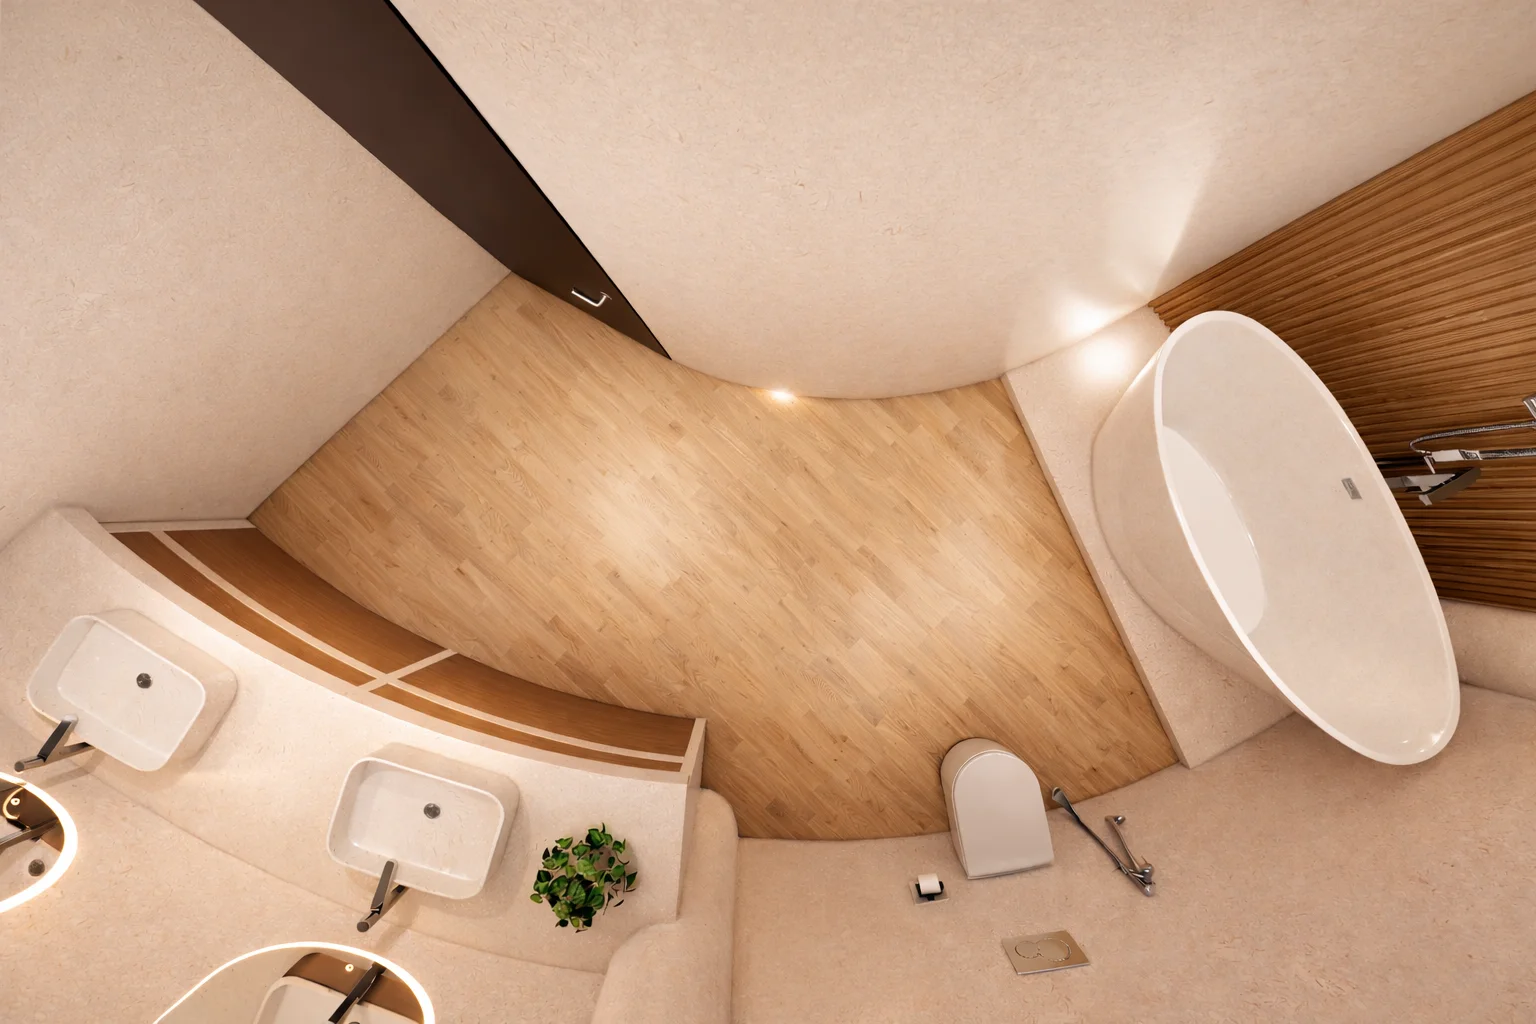
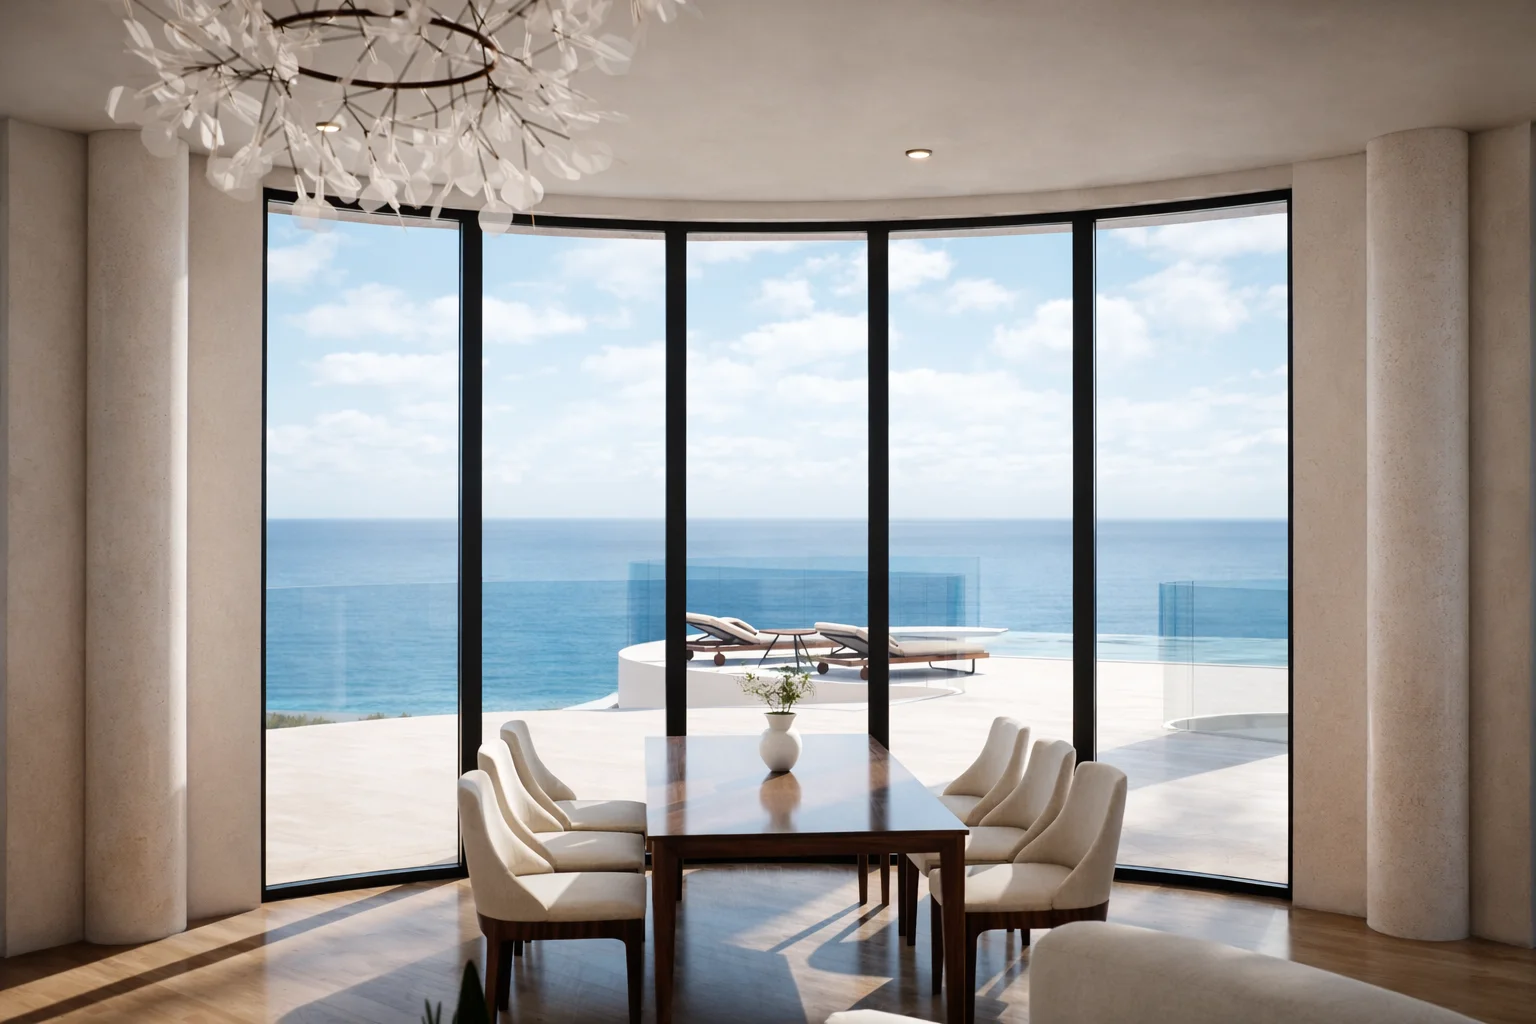
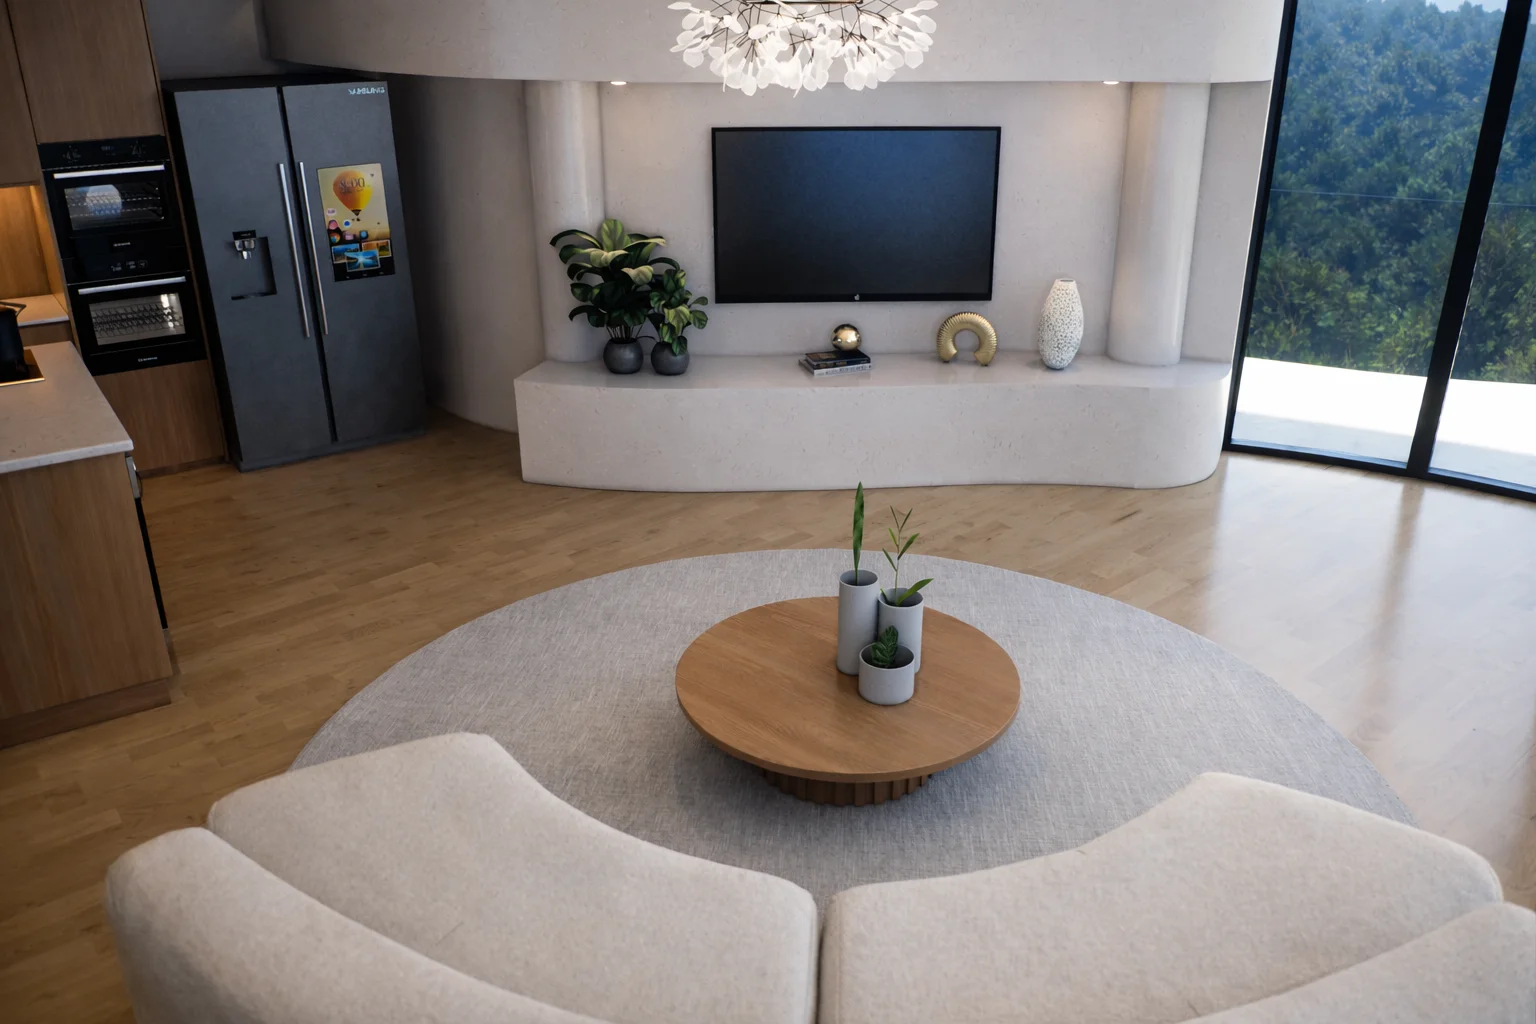
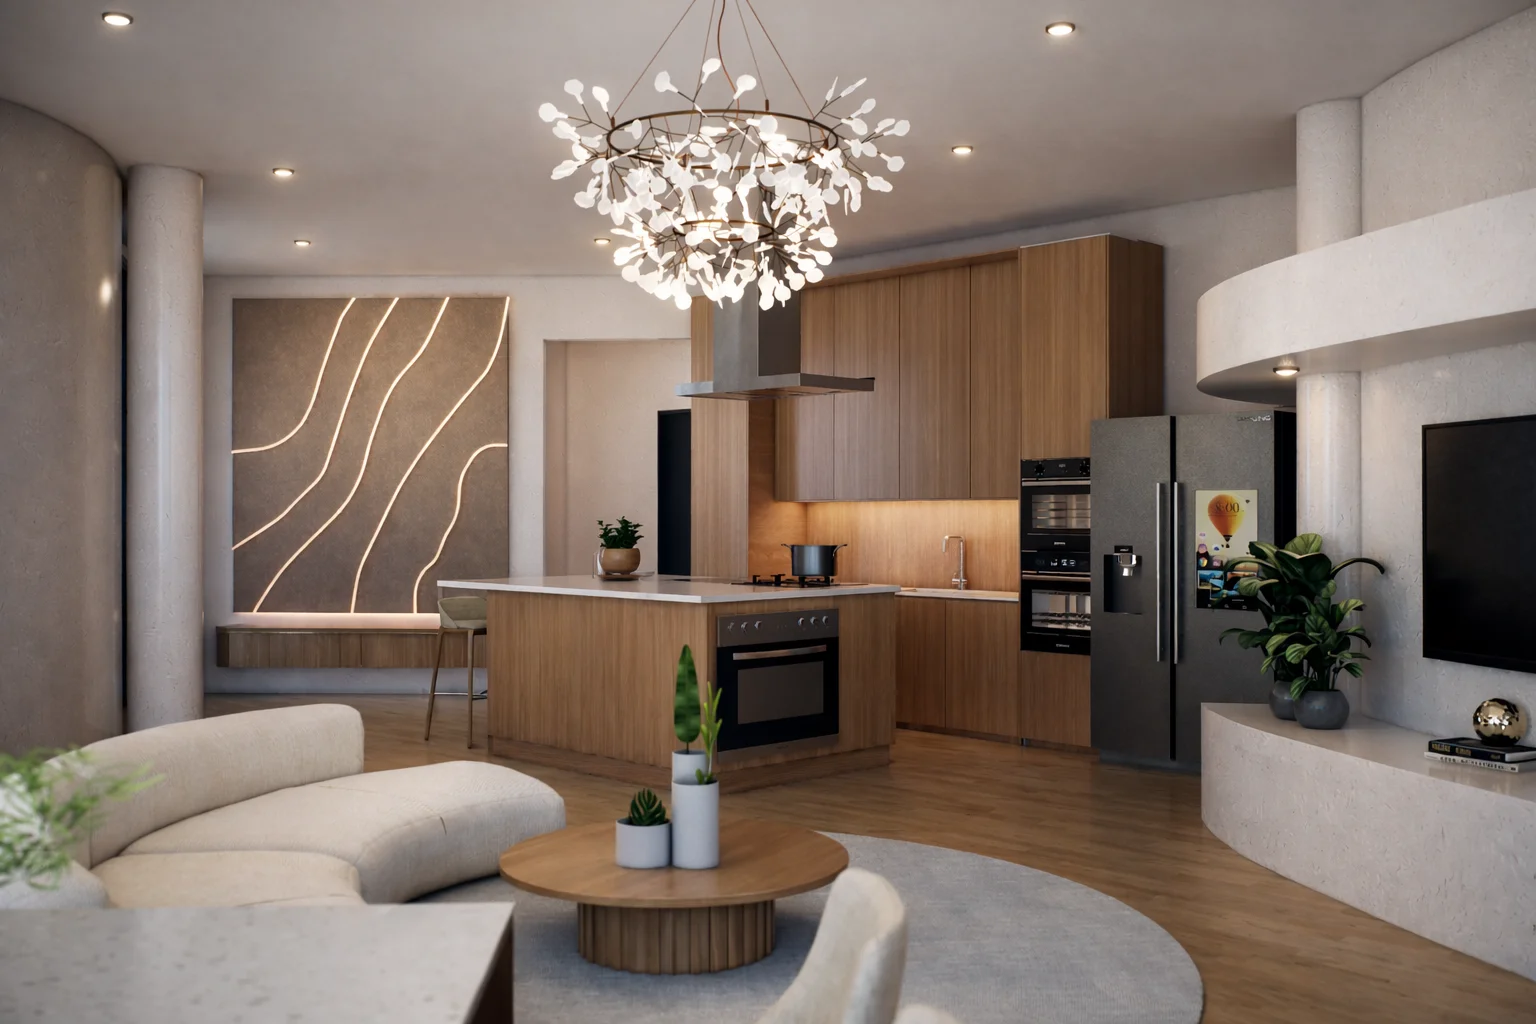
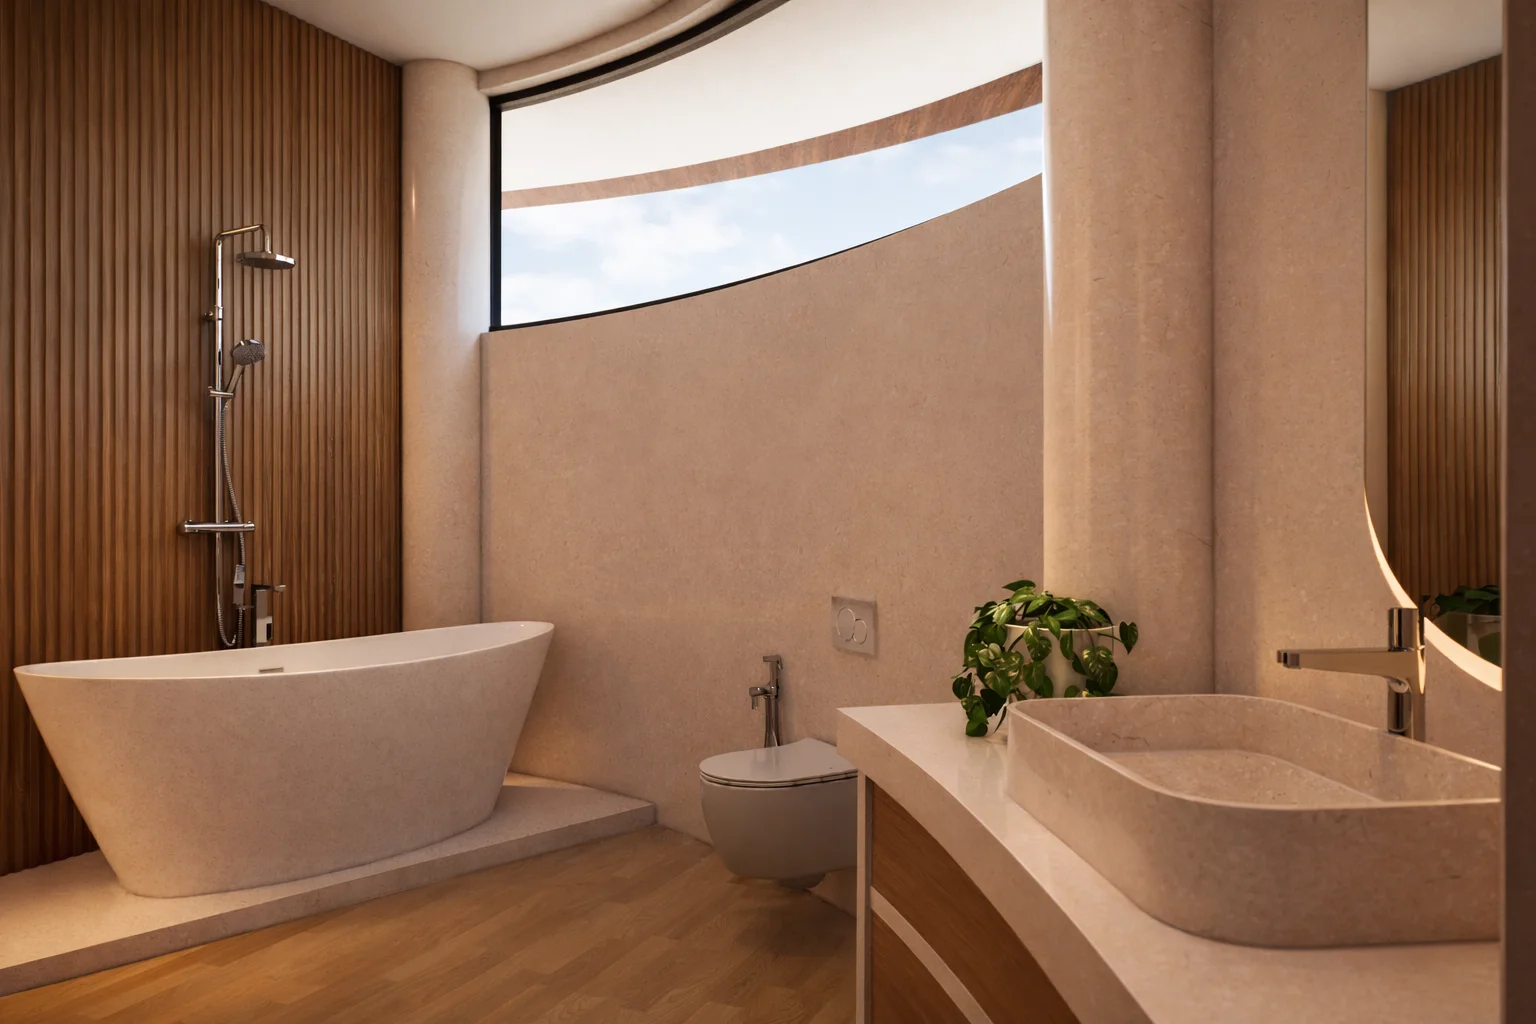
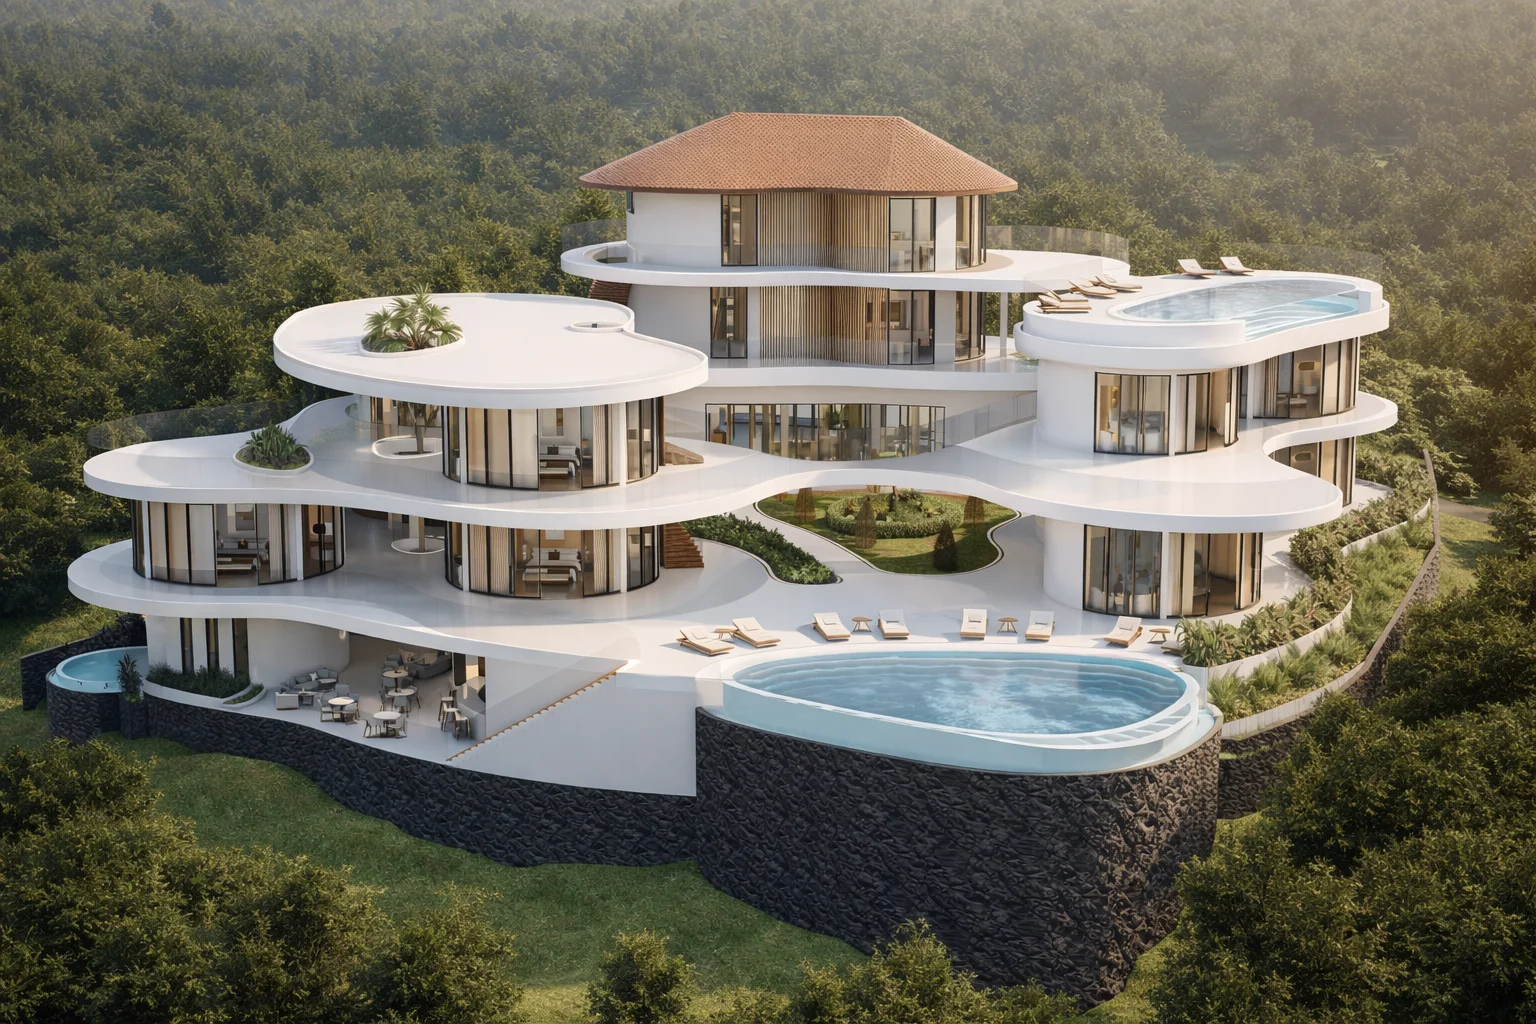
The Nusa Penida Cliffside project represents the pinnacle of eco-luxury architecture and high-end hospitality. Set upon a 5,000 sqm oceanfront estate with direct sea access, the resort masterfully integrates sustainable design with sophisticated living. Each of the 8 exclusive villas is envisioned as a private sanctuary, featuring bespoke interior design, private pools, and a seamless indoor-outdoor flow that redefines the luxury island experience.
An exclusive boutique resort destination on the legendary island of Nusa Penida, featuring 8 ultra-luxury villas with breathtaking, infinite ocean views. This premier architectural development offers the ultimate luxury villa experience near Bali, combining sophisticated design with unparalleled coastal vistas.
€3,680k
€50k
22.70%
Proprietà
Scopri il mix di ville e suite premium che guidano i ricavi del resort, con tariffe medie giornaliere (ADR) parametrate in base all'esclusività.
Piuttosto che una semplice media, la tariffa media giornaliera (ADR) del resort di €411.25 è calcolata dinamicamente tramite media ponderata sul mix di inventario. Ciò genera pro-forma di rendimento precisi e corretti per il rischio.
Nelle operazioni di boutique di lusso, le camere generano solo una parte del rendimento totale. I pro-forma integrano flussi di ricavi aggiuntivi calcolati in rapporto ai ricavi delle camere:
Nusa Penida: The emerging epicenter of eco-luxury tourism in Bali, witnessing record-breaking growth in the premium sector—a premier destination for sustainable architecture and high-end luxury villa development.


| Metric | Value |
|---|---|
| Land Cost | €736.000 (est.) |
| Construction Cost | €2.208.000 (est.) |
| Development Cost | €736.000 (est.) |
| Projected Exit Value | €5.520.000 (est.) |
| ROI | 22.70% |
| Timeline | 18 Mesi |
Data-driven strategic analysis: transitioning from transient daily visitors to high-yield, extended luxury stays.
The project is strategically situated within the ultra-luxury hospitality segment of Nusa Penida, leveraging a prime cliffside location that ensures absolute privacy and panoramic ocean vistas. The signature Domo Resort architecture is not merely an aesthetic statement, but a calculated investment move designed to command a premium Average Daily Rate (ADR) significantly above the regional market average.
We implement a lean operational management model specifically engineered to minimize overhead and maximize EBITDA margins. The resort’s low-density master plan facilitates an elite guest-to-staff ratio, delivering a bespoke, high-end service experience without the prohibitive fixed costs typical of conventional large-scale hotel developments.
Nusa Penida has undergone a massive transformation, growing from 200,000 arrivals in 2017 to over 1.1 million in 2024. The market is currently at a critical inflection point: shifting from "day-trip" excursions to extended luxury stays. Institutional investors and the burgeoning "slow-travel" demographic are increasingly seeking exclusive, low-density environments. By securing a position in this privileged cliffside enclave, Antonio Rutilio Design captures the early maturity phase of the island’s luxury boom, offering projected capital appreciation that outpaces saturated markets like Canggu.
Simula i tuoi rendimenti regolando l'importo dell'investimento qui sotto.
27.1%
€1.9M
44.0%
5 Anni
Anno 7
€4.0M
€27.100
Basato su un TIR del 27.1%Il progetto è concepito come un boutique resort a bassa densità e ad alto margine, ottimizzando sia le tariffe che l'efficienza operativa. I ricavi sono guidati da un posizionamento premium, unità con vista sull'oceano e una forte domanda di ospitalità esperienziale a Nusa Penida.
I costi operativi sono controllati attraverso un modello operativo snello e l'outsourcing selettivo di servizi non essenziali, garantendo la massima conversione in EBITDA.
>Nusa Penida è una delle destinazioni in più rapida crescita di Bali, con una crescente domanda di sistemazioni di lusso e di design.
I'm sorry, but there is no content provided to localize. Please provide the text or content you would like to have localized for the English market.
Il progetto punta a un margine EBITDA stabilizzato di circa il 40–45%, generando un flusso di cassa annuale costante. Gli investitori beneficiano di:
Il progetto adotta un approccio finanziario prudenziale con ipotesi realistiche di occupazione e tariffe.
Riduzione della complessità operativa e dei costi del personale.
Identità architettonica a supporto di un ADR premium.
Flussi di entrate da alloggio, F&B e benessere.
Coinvolgimento diretto dello sponsor nello sviluppo e nel controllo.
Disclaimer: Questo materiale ha solo scopo informativo e non costituisce un'offerta o una sollecitazione all'investimento. I dettagli sono forniti su richiesta per i partner qualificati.
Questo grafico rappresenta la distribuzione strategica dell'investimento totale di €3.680.000. Le fasi di progettazione, diritti sul terreno e costruzione hanno la priorità per garantire la longevità dell'asset e un posizionamento di massimo livello.
| Categoria | Voce d'Investimento | Importo |
|---|---|---|
| Acquisizione Terreno | Freehold Acquisition | €720.000 |
| Costruzione | Struttura Principale e Tetto | €1.500.000 |
| Arredi e Interni | Pacchetto FF&E Elite (Arredi, Corredi e Attrezzature) | €450.000 |
| Altro | Riserva di Sicurezza | €290.000 |
| Design e Architettura | Progettazione Architettonica e Tecnica | €300.000 |
| Arredi e Interni | Illuminazione e Decorazione d'Interni | €80.000 |
| Arredi e Interni | Impianti Tecnologici (Climatizzazione, Idraulica) | €120.000 |
| Gestione del progetto | Gestione del Progetto (Project Management) | €70.000 |
| Design e Architettura | Consulenza Ingegneristica | €50.000 |
| Permessi e Legale | Permessi di Costruzione e Licenze | €60.000 |
| Permessi e Legale | Spese Legali e Costituzione Società | €15.000 |
| Altro | Formazione e Assunzione del Personale | €25.000 |
| CAPITALE TOTALE STIMATO | €3.680.000 | |
Queste cifre rappresentano i benchmark istituzionali per la località e la classe di attività. La Modalità Scenario sposta queste variabili per simulare il rischio.
Reddito lordo totale generato durante il ciclo di vita del progetto.
Capitale netto rimanente dopo tutti i costi e il recupero dell'investimento.
Performance operativa esclusi elementi non monetari e tasse.
Quota di utile netto attribuibile al tuo specifico investimento.
Recupero totale del capitale ottenuto prima della fase di stabilizzazione. Questo modello illustra un profilo di rischio-rendimento equilibrato, con una forte generazione di flussi di cassa e una chiara tempistica di recupero del capitale.
| Anno | Occupazione Stimata | Ricavi Lordi | Utile Operativo (EBITDA) | Cash Flow Netto |
|---|---|---|---|---|
| Year 1 | 55% | €1.212.028 | €387.849 | €318.036 |
| Year 2 | 65% | €1.475.369 | €531.133 | €435.529 |
| Year 3 | 75% | €1.751.932 | €700.773 | €574.634 |
| Year 4 | 77% | €1.849.555 | €776.813 | €636.987 |
| Year 5 | 75% | €1.851.097 | €814.483 | €667.876 |
| Year 6 | 75% | €1.900.680 | €836.299 | €685.766 |
| Year 7 | 75% | €1.950.263 | €858.116 | €703.655 |
| Year 8 | 75% | €1.999.846 | €879.932 | €721.545 |
| Year 9 | 75% | €2.049.429 | €901.749 | €739.434 |
| Year 10 | 75% | €2.099.012 | €923.565 | €757.324 |
| Year 11 | 75% | €2.161.983 | €951.272 | €780.043 |
| Year 12 | 75% | €2.226.842 | €979.811 | €803.445 |
| Year 13 | 75% | €2.293.647 | €1.009.205 | €827.548 |
| Year 14 | 75% | €2.362.457 | €1.039.481 | €852.374 |
| Year 15 | 75% | €2.433.331 | €1.070.665 | €877.946 |
| Year 16 | 75% | €2.506.331 | €1.102.785 | €904.284 |
| Year 17 | 75% | €2.581.520 | €1.135.869 | €931.413 |
| Year 18 | 75% | €2.658.966 | €1.169.945 | €959.355 |
| Year 19 | 75% | €2.738.735 | €1.205.043 | €988.136 |
| Year 20 | 75% | €2.820.897 | €1.241.195 | €1.017.780 |
| Year 21 | 75% | €2.905.524 | €1.278.431 | €1.048.313 |
| Year 22 | 75% | €2.992.690 | €1.316.783 | €1.079.762 |
| Year 23 | 75% | €3.082.470 | €1.356.287 | €1.112.155 |
| Year 24 | 75% | €3.174.945 | €1.396.976 | €1.145.520 |
| Year 25 | 75% | €3.270.193 | €1.438.885 | €1.179.886 |
| Year 26 | 75% | €3.368.299 | €1.482.051 | €1.215.282 |
| Year 27 | 75% | €3.469.348 | €1.526.513 | €1.251.741 |
| Year 28 | 75% | €3.573.428 | €1.572.308 | €1.289.293 |
| Year 29 | 75% | €3.680.631 | €1.619.478 | €1.327.972 |
| Year 30 | 75% | €3.791.050 | €1.668.062 | €1.367.811 |
| Year 31 | 75% | €3.904.781 | €1.718.104 | €1.408.845 |
| Year 32 | 75% | €4.021.925 | €1.769.647 | €1.451.110 |
| Year 33 | 75% | €4.142.582 | €1.822.736 | €1.494.644 |
| Year 34 | 75% | €4.266.860 | €1.877.418 | €1.539.483 |
| Year 35 | 75% | €4.394.866 | €1.933.741 | €1.585.668 |
| Year 36 | 75% | €4.526.712 | €1.991.753 | €1.633.238 |
| Year 37 | 75% | €4.662.513 | €2.051.506 | €1.682.235 |
| Year 38 | 75% | €4.802.388 | €2.113.051 | €1.732.702 |
| Year 39 | 75% | €4.946.460 | €2.176.442 | €1.784.683 |
| Year 40 | 75% | €5.094.854 | €2.241.736 | €1.838.223 |
| Year 41 | 75% | €5.247.700 | €2.308.988 | €1.893.370 |
| Year 42 | 75% | €5.405.130 | €2.378.257 | €1.950.171 |
| Year 43 | 75% | €5.567.284 | €2.449.605 | €2.008.676 |
| Year 44 | 75% | €5.734.303 | €2.523.093 | €2.068.936 |
| Year 45 | 75% | €5.906.332 | €2.598.786 | €2.131.005 |
| Year 46 | 75% | €6.083.522 | €2.676.750 | €2.194.935 |
| Year 47 | 75% | €6.266.028 | €2.757.052 | €2.260.783 |
| Year 48 | 75% | €6.454.008 | €2.839.764 | €2.328.606 |
| Year 49 | 75% | €6.647.629 | €2.924.957 | €2.398.464 |
| Year 50 | 75% | €6.847.058 | €3.012.705 | €2.470.418 |
| Year 51 | 75% | €7.052.469 | €3.103.087 | €2.544.531 |
| Year 52 | 75% | €7.264.043 | €3.196.179 | €2.620.867 |
| Year 53 | 75% | €7.481.965 | €3.292.064 | €2.699.493 |
| Year 54 | 75% | €7.706.424 | €3.390.826 | €2.780.478 |
| Year 55 | 75% | €7.937.616 | €3.492.551 | €2.863.892 |
| Year 56 | 75% | €8.175.745 | €3.597.328 | €2.949.809 |
| Year 57 | 75% | €8.421.017 | €3.705.248 | €3.038.303 |
| Year 58 | 75% | €8.673.648 | €3.816.405 | €3.129.452 |
| Year 59 | 75% | €8.933.857 | €3.930.897 | €3.223.336 |
| Year 60 | 75% | €9.201.873 | €4.048.824 | €3.320.036 |
| Year 61 | 75% | €9.477.929 | €4.170.289 | €3.419.637 |
| Year 62 | 75% | €9.762.267 | €4.295.397 | €3.522.226 |
| Year 63 | 75% | €10.055.135 | €4.424.259 | €3.627.893 |
| Year 64 | 75% | €10.356.789 | €4.556.987 | €3.736.729 |
| Year 65 | 75% | €10.667.493 | €4.693.697 | €3.848.831 |
| Year 66 | 75% | €10.987.517 | €4.834.508 | €3.964.296 |
| Year 67 | 75% | €11.317.143 | €4.979.543 | €4.083.225 |
| Year 68 | 75% | €11.656.657 | €5.128.929 | €4.205.722 |
| Year 69 | 75% | €12.006.357 | €5.282.797 | €4.331.894 |
| Year 70 | 75% | €12.366.548 | €5.441.281 | €4.461.850 |
| Year 71 | 75% | €12.737.544 | €5.604.519 | €4.595.706 |
| Year 72 | 75% | €13.119.670 | €5.772.655 | €4.733.577 |
| Year 73 | 75% | €13.513.261 | €5.945.835 | €4.875.584 |
| Year 74 | 75% | €13.918.658 | €6.124.210 | €5.021.852 |
| Year 75 | 75% | €14.336.218 | €6.307.936 | €5.172.507 |
| Year 76 | 75% | €14.766.305 | €6.497.174 | €5.327.683 |
| Year 77 | 75% | €15.209.294 | €6.692.089 | €5.487.513 |
| Year 78 | 75% | €15.665.573 | €6.892.852 | €5.652.139 |
| Year 79 | 75% | €16.135.540 | €7.099.637 | €5.821.703 |
| Year 80 | 75% | €16.619.606 | €7.312.627 | €5.996.354 |
| Year 81 | 75% | €17.118.194 | €7.532.005 | €6.176.244 |
| Year 82 | 75% | €17.631.740 | €7.757.966 | €6.361.532 |
| Year 83 | 75% | €18.160.692 | €7.990.705 | €6.552.378 |
| Year 84 | 75% | €18.705.513 | €8.230.426 | €6.748.949 |
| Year 85 | 75% | €19.266.678 | €8.477.338 | €6.951.418 |
| Year 86 | 75% | €19.844.679 | €8.731.659 | €7.159.960 |
| Year 87 | 75% | €20.440.019 | €8.993.608 | €7.374.759 |
| Year 88 | 75% | €21.053.220 | €9.263.417 | €7.596.002 |
| Year 89 | 75% | €21.684.816 | €9.541.319 | €7.823.882 |
| Year 90 | 75% | €22.335.361 | €9.827.559 | €8.058.598 |
| Year 91 | 75% | €23.005.421 | €10.122.385 | €8.300.356 |
| Year 92 | 75% | €23.695.584 | €10.426.057 | €8.549.367 |
| Year 93 | 75% | €24.406.452 | €10.738.839 | €8.805.848 |
| Year 94 | 75% | €25.138.645 | €11.061.004 | €9.070.023 |
| Year 95 | 75% | €25.892.805 | €11.392.834 | €9.342.124 |
| Year 96 | 75% | €26.669.589 | €11.734.619 | €9.622.388 |
| Year 97 | 75% | €27.469.676 | €12.086.658 | €9.911.059 |
| Year 98 | 75% | €28.293.767 | €12.449.257 | €10.208.391 |
| Year 99 | 75% | €29.142.580 | €12.822.735 | €10.514.643 |
| Year 100 | 75% | €30.016.857 | €13.207.417 | €10.830.082 |
+3.50% Annuale
+2.50% Annuale
11.4% Obiettivo
| ADR \ OCC | 65% | 70% | 75% | 80% | 85% |
|---|---|---|---|---|---|
| €200 | 21.3% | 22.6% | 23.9% | 25.2% | 26.5% |
| €225 | 23.4% | 24.9% | 26.3% | 27.8% | 29.2% |
| €250 | 25.5% | 27.1% | 28.7% | 30.4% | 32.0% |
| €275 | 27.6% | 29.4% | 31.2% | 33.0% | 34.7% |
| €300 | 29.7% | 31.7% | 33.6% | 35.5% | 37.5% |
Legal Disclaimer: This sensitivity analysis is based on historical market performance and projected operational standards in Nusa Penida. Actual results may vary depending on global tourism trends, local regulations, and macroeconomic factors. This is not a guarantee of future returns.
Scarica la panoramica tecnica e finanziaria completa del progetto.
Disponibile esclusivamente per gli investitori autorizzati.
Registrati per Accedere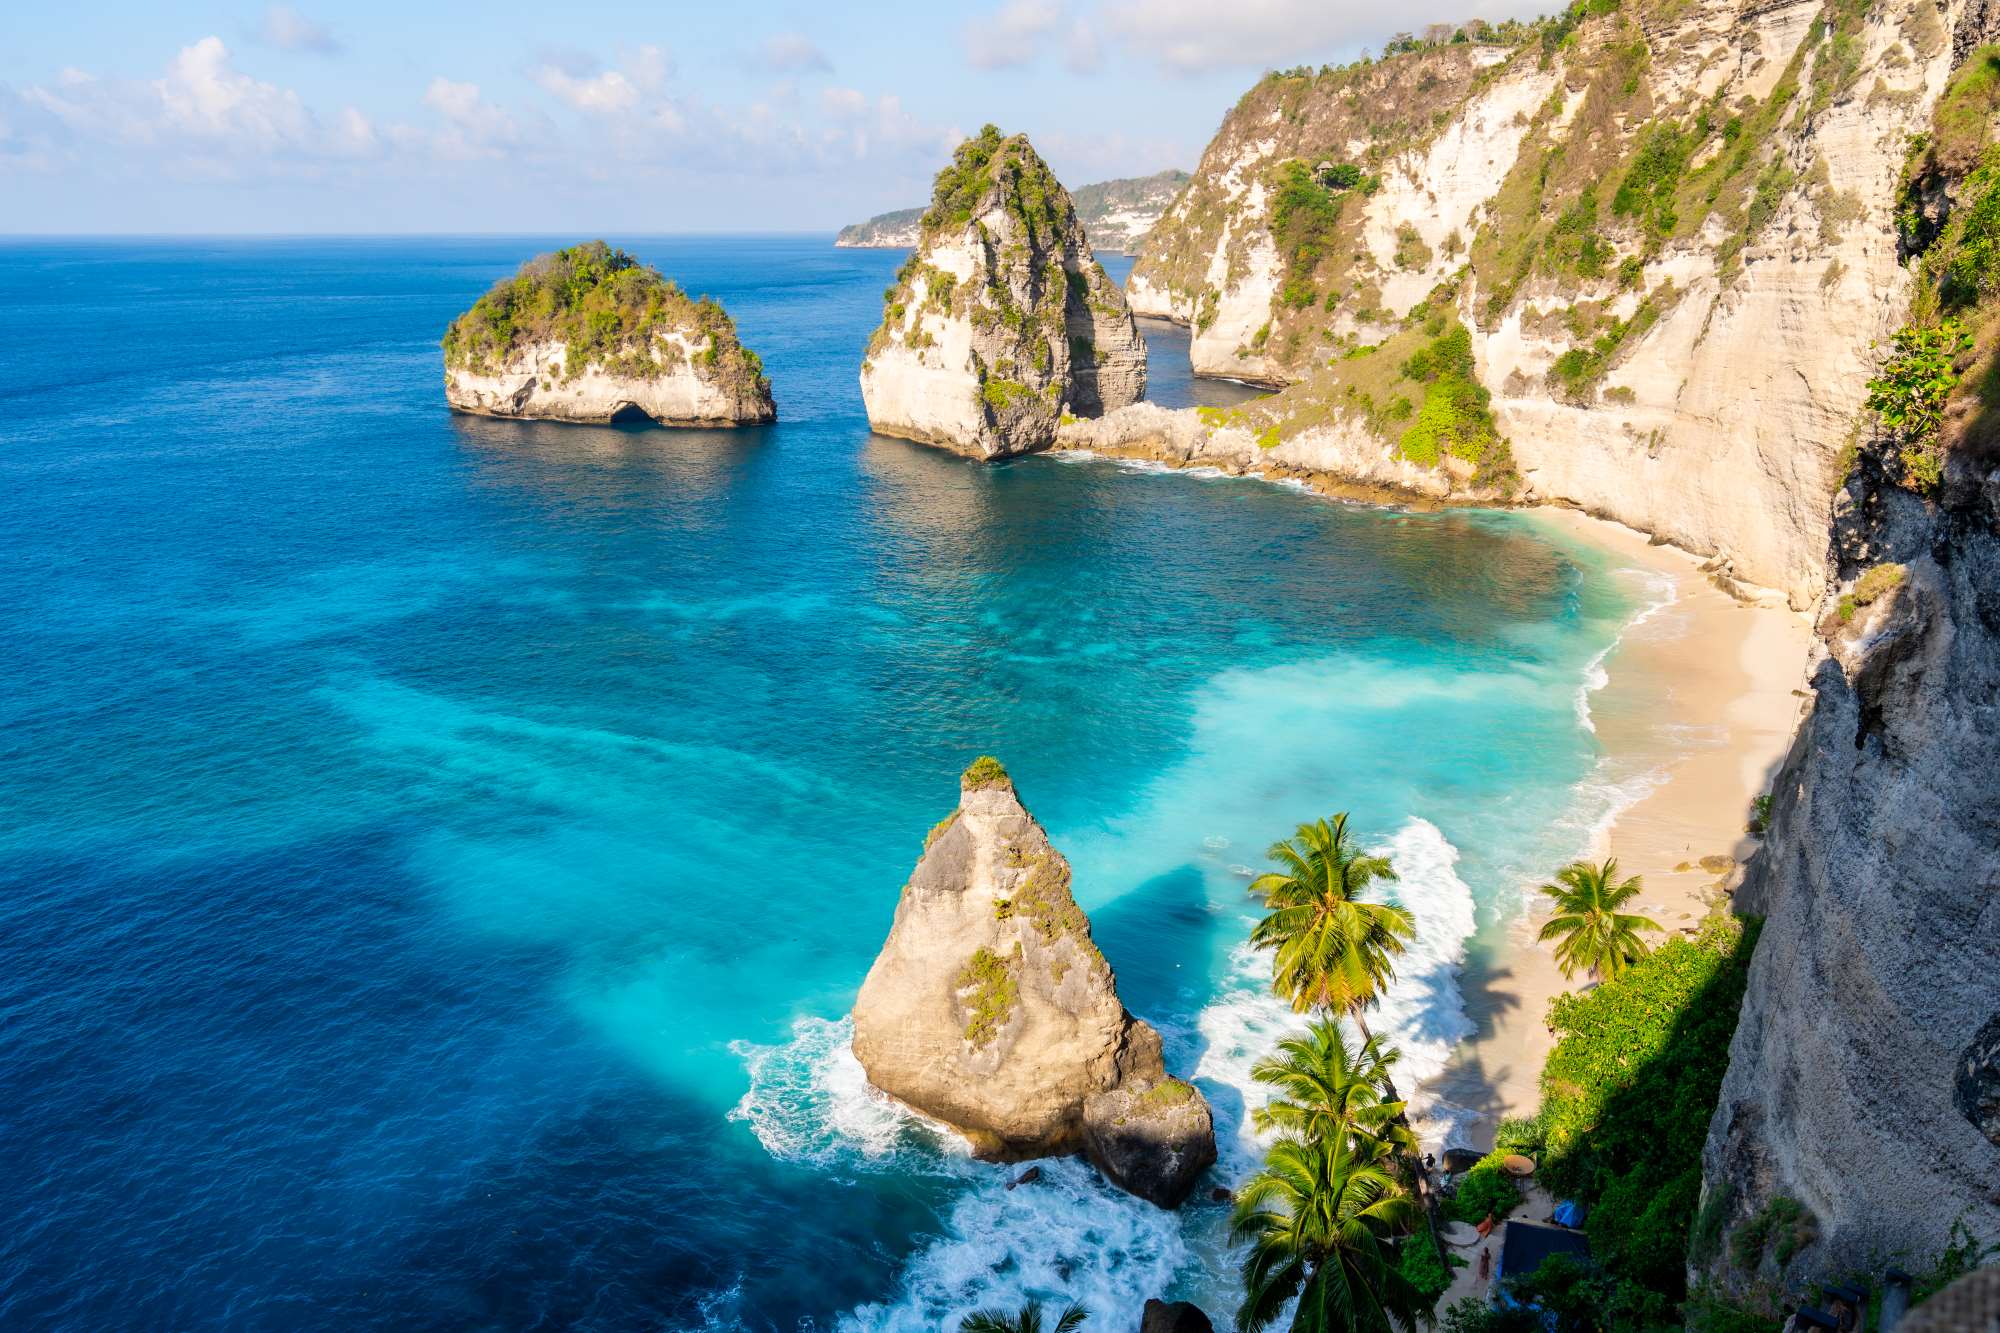
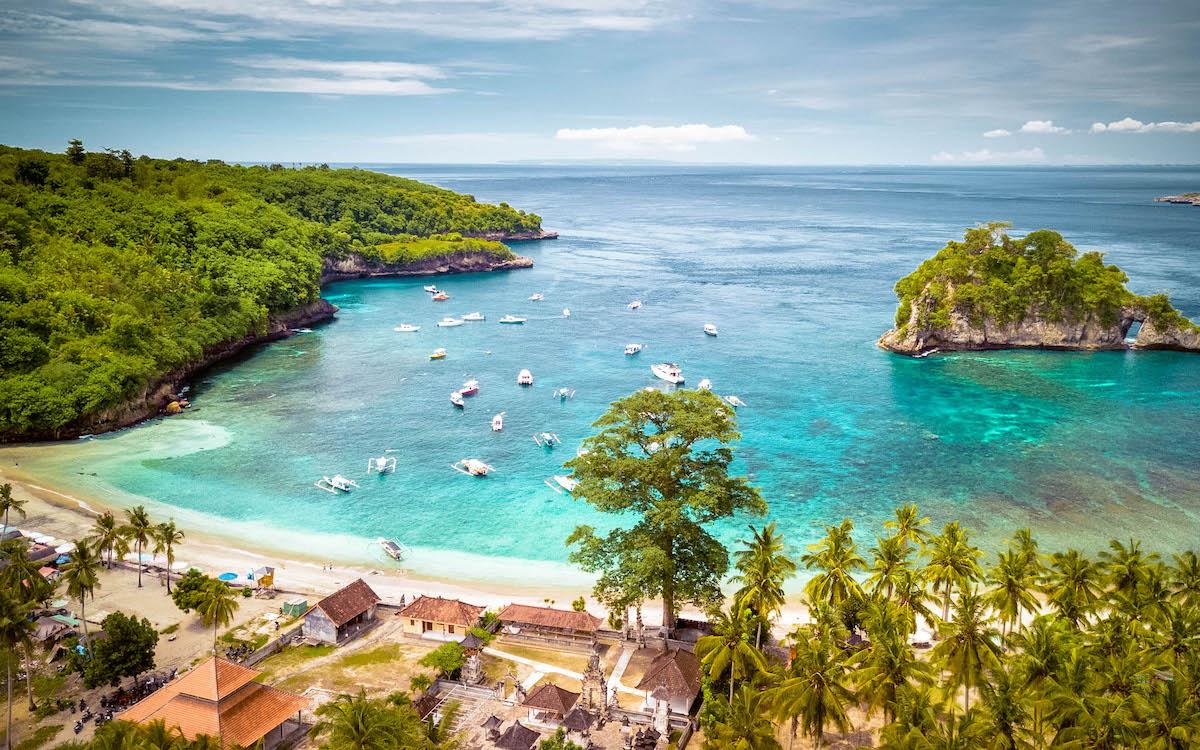
Unbelievable cliffside white sand beach on the eastern tip of Nusa Penida.
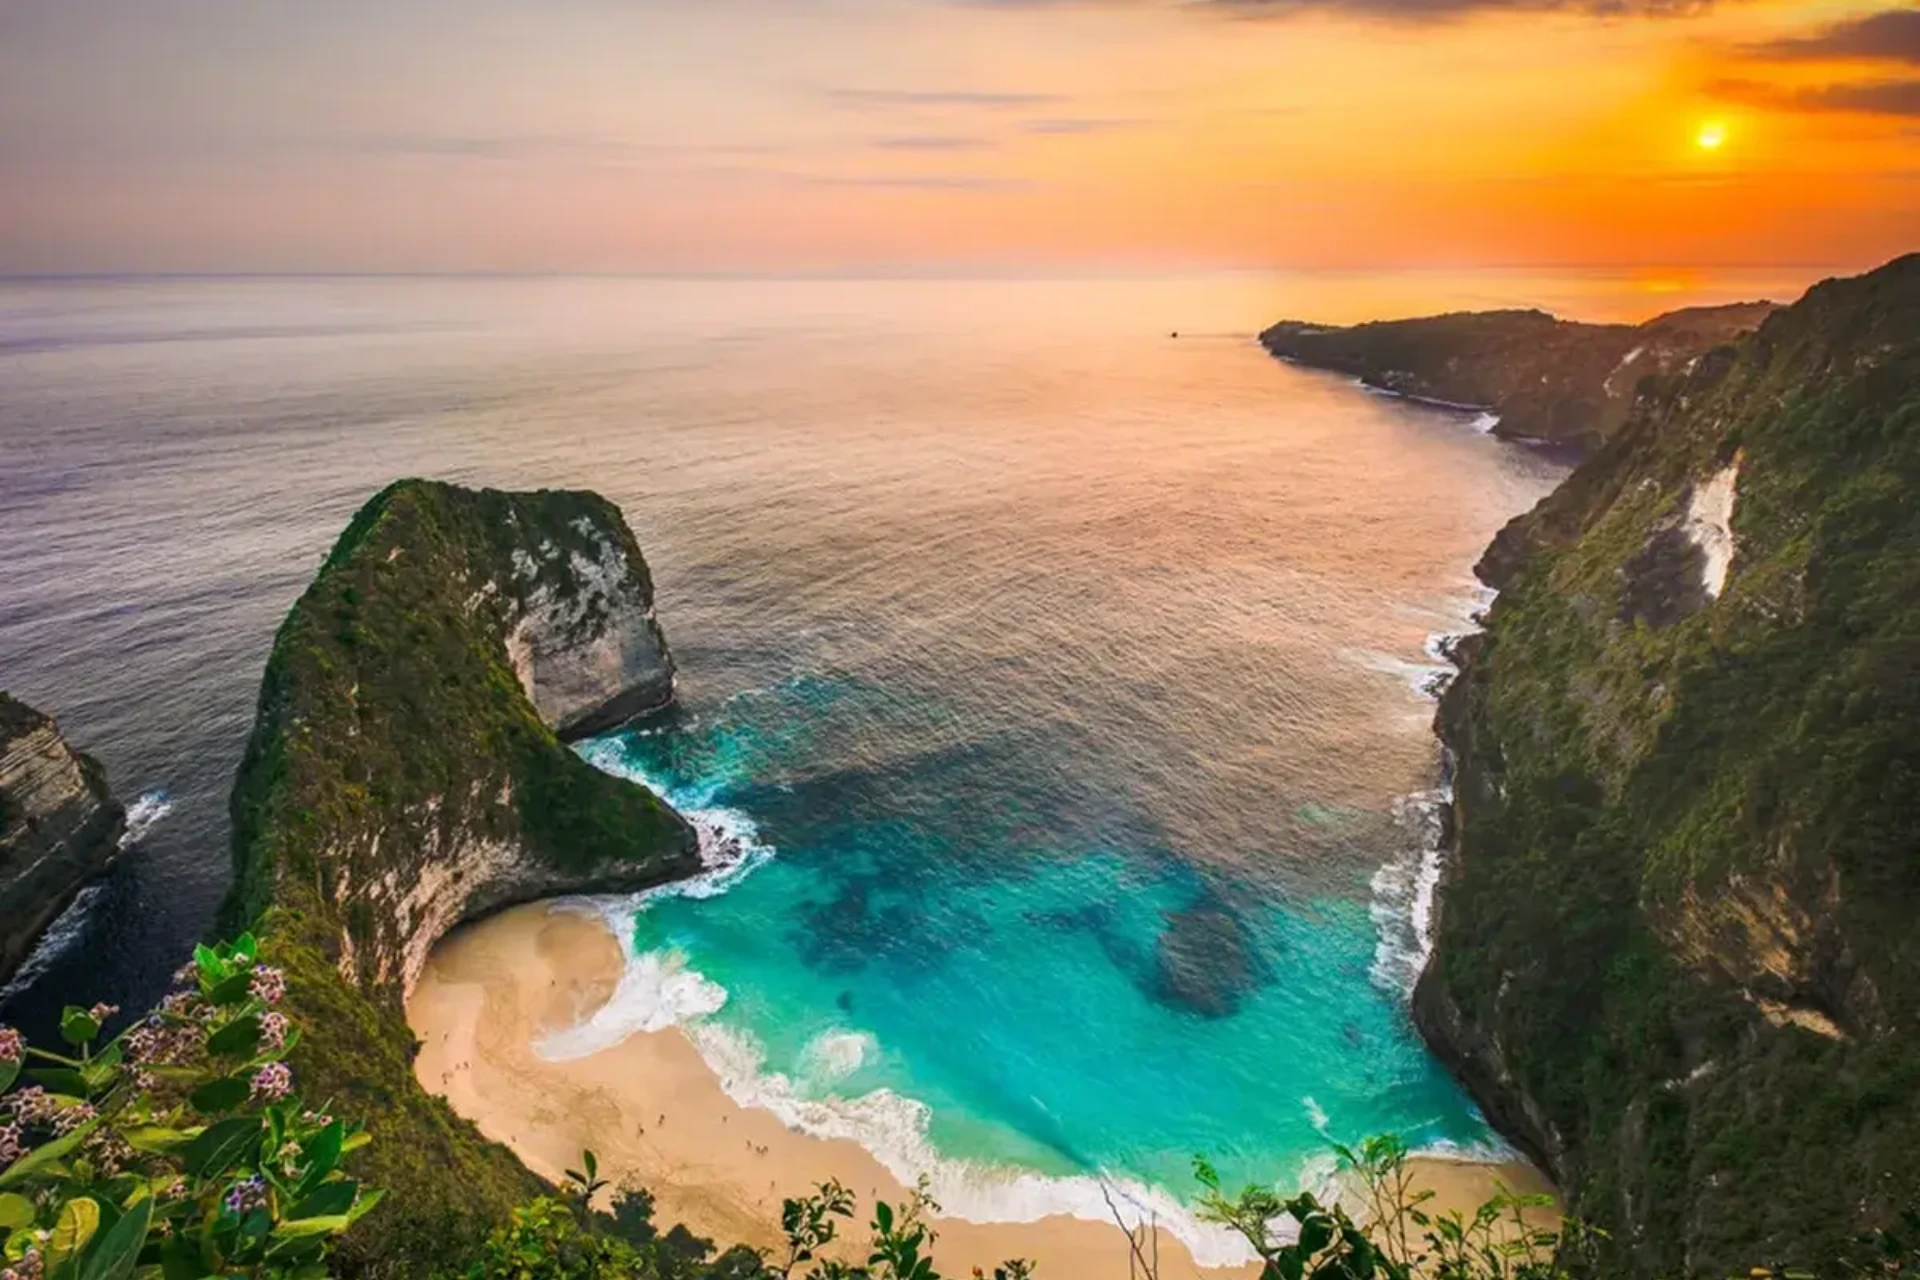
The famous T-Rex shaped cliff and pristine white sand beach below.
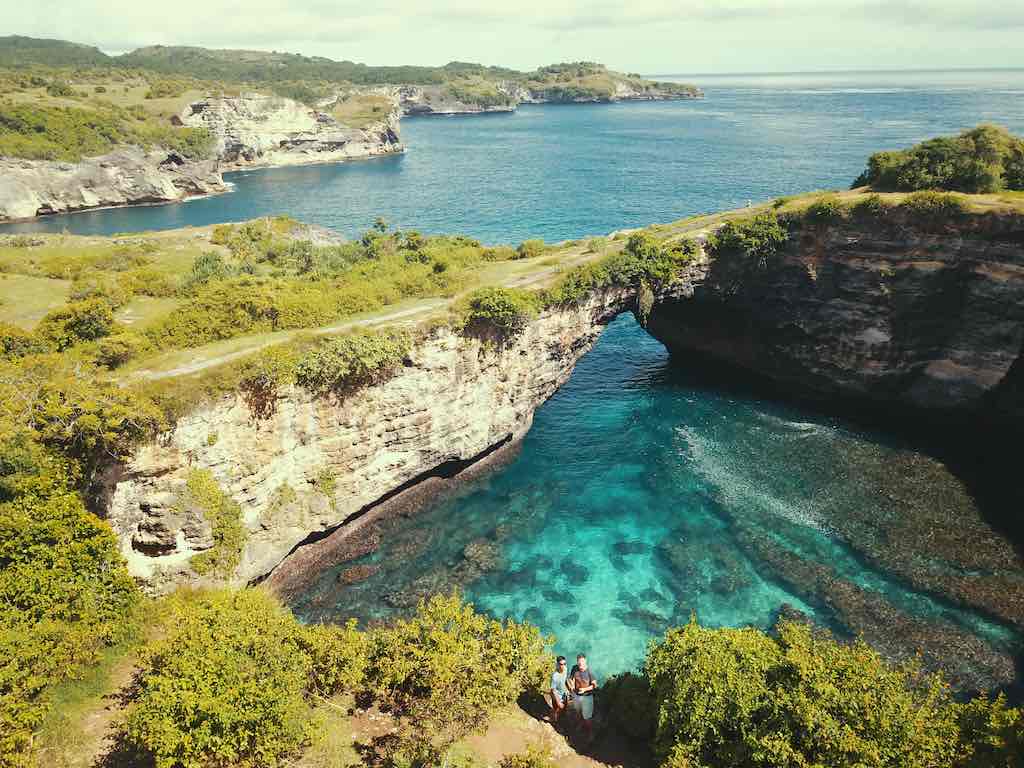
A scenic natural bridge arch over a turquoise sea cove.
Famous palm-fringed beach offering spectacular Balinese sunsets and snorkeling.

Famous beachside bar known for live music, sunset views, and signature cocktails.

Popular day club featuring a large pool, relaxed atmosphere, and international DJ sets.
Premium beach club near Toyapakeh harbor with direct beach access and luxury daybeds.
Iconic sunset destination offering panoramic ocean views and private bamboo nests.