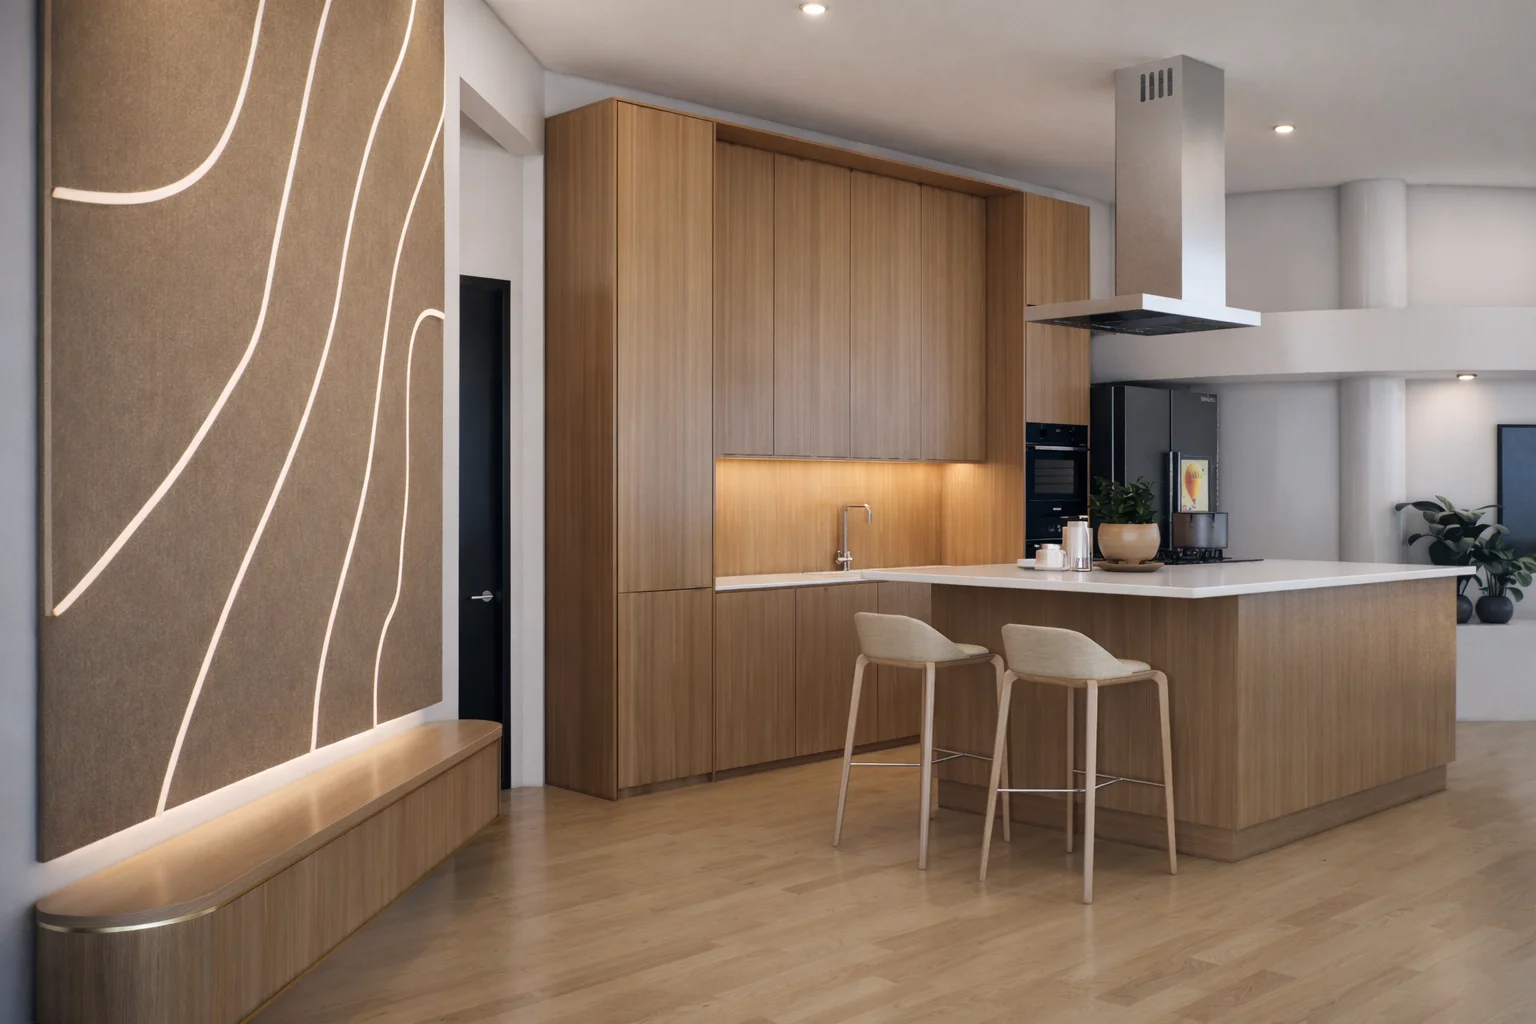
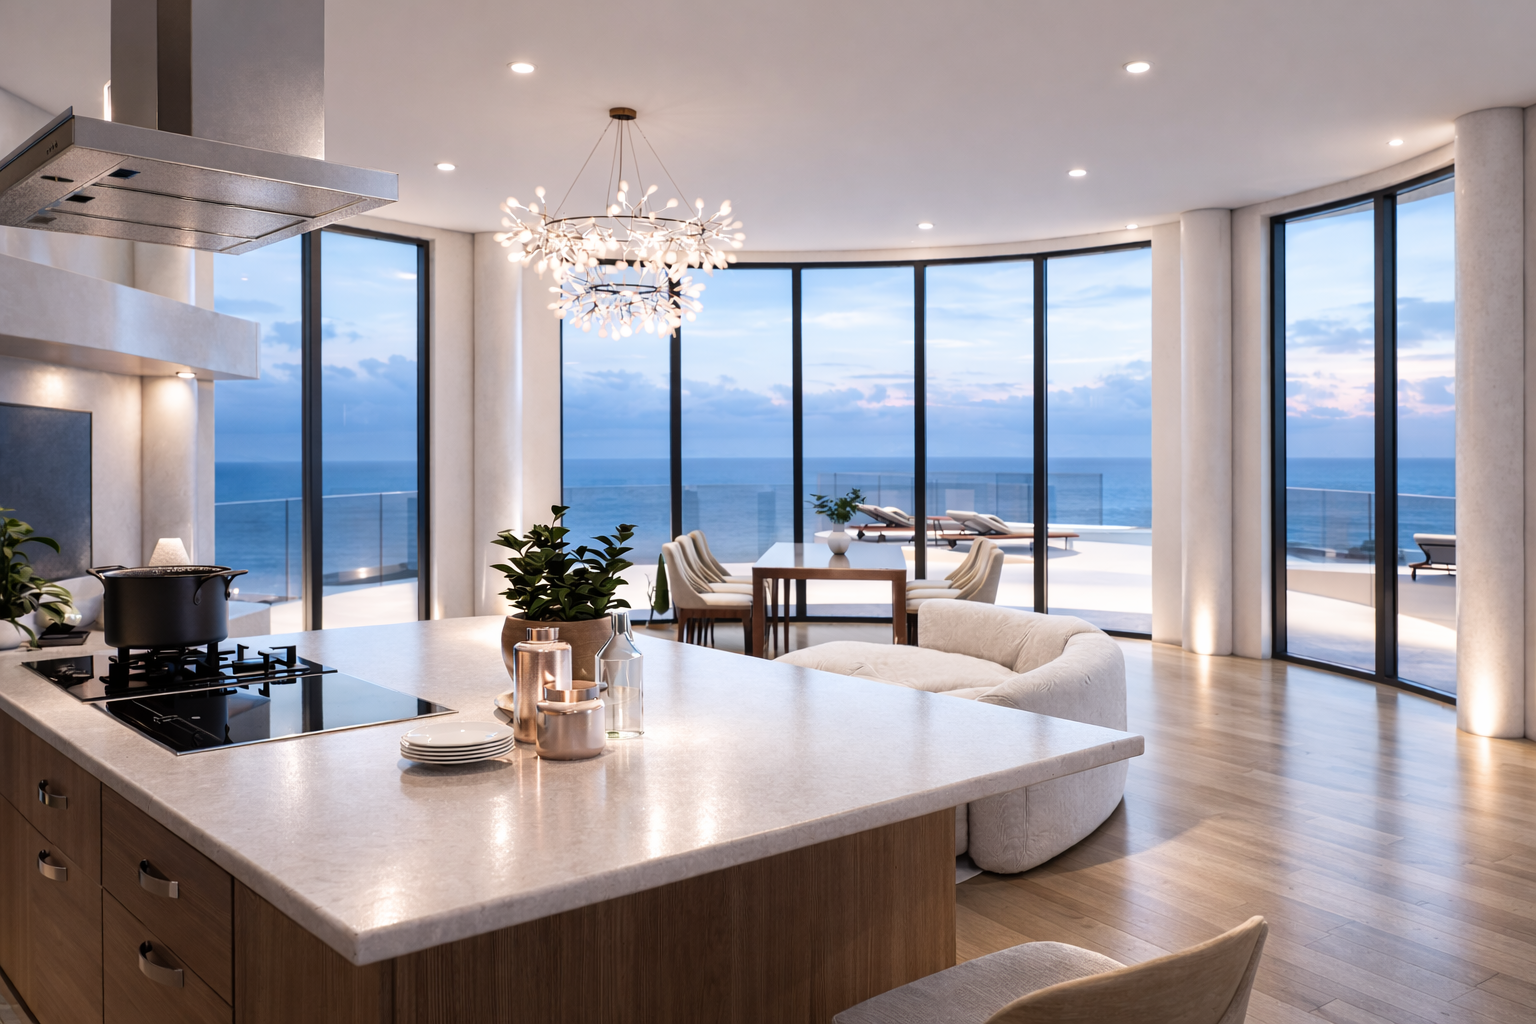
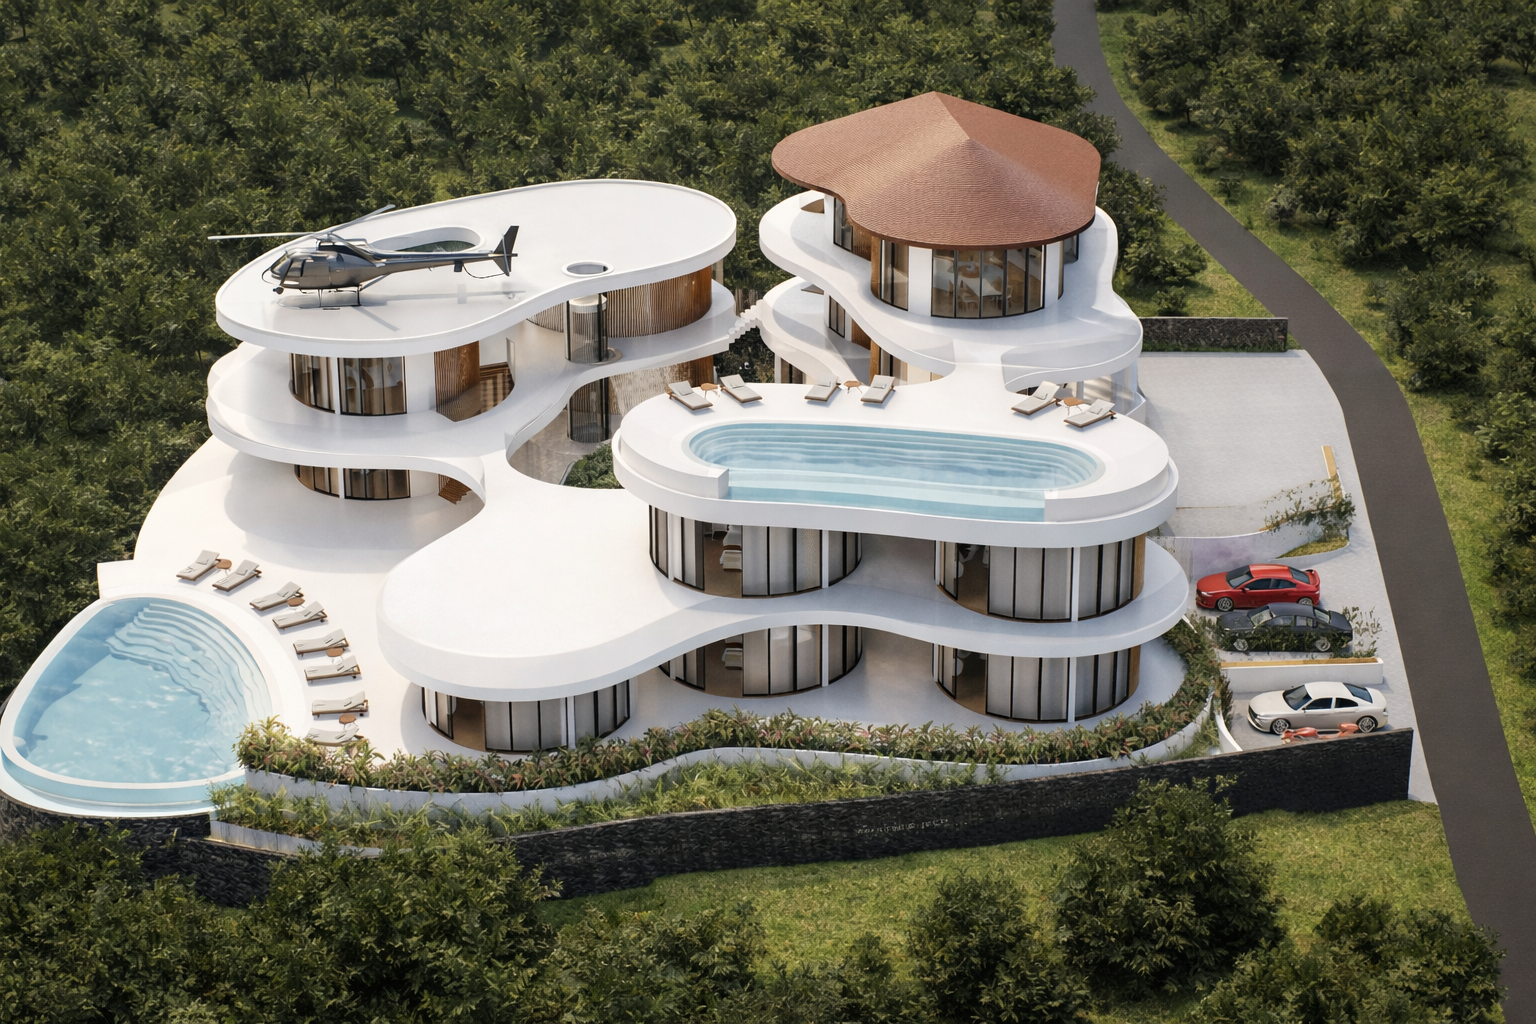
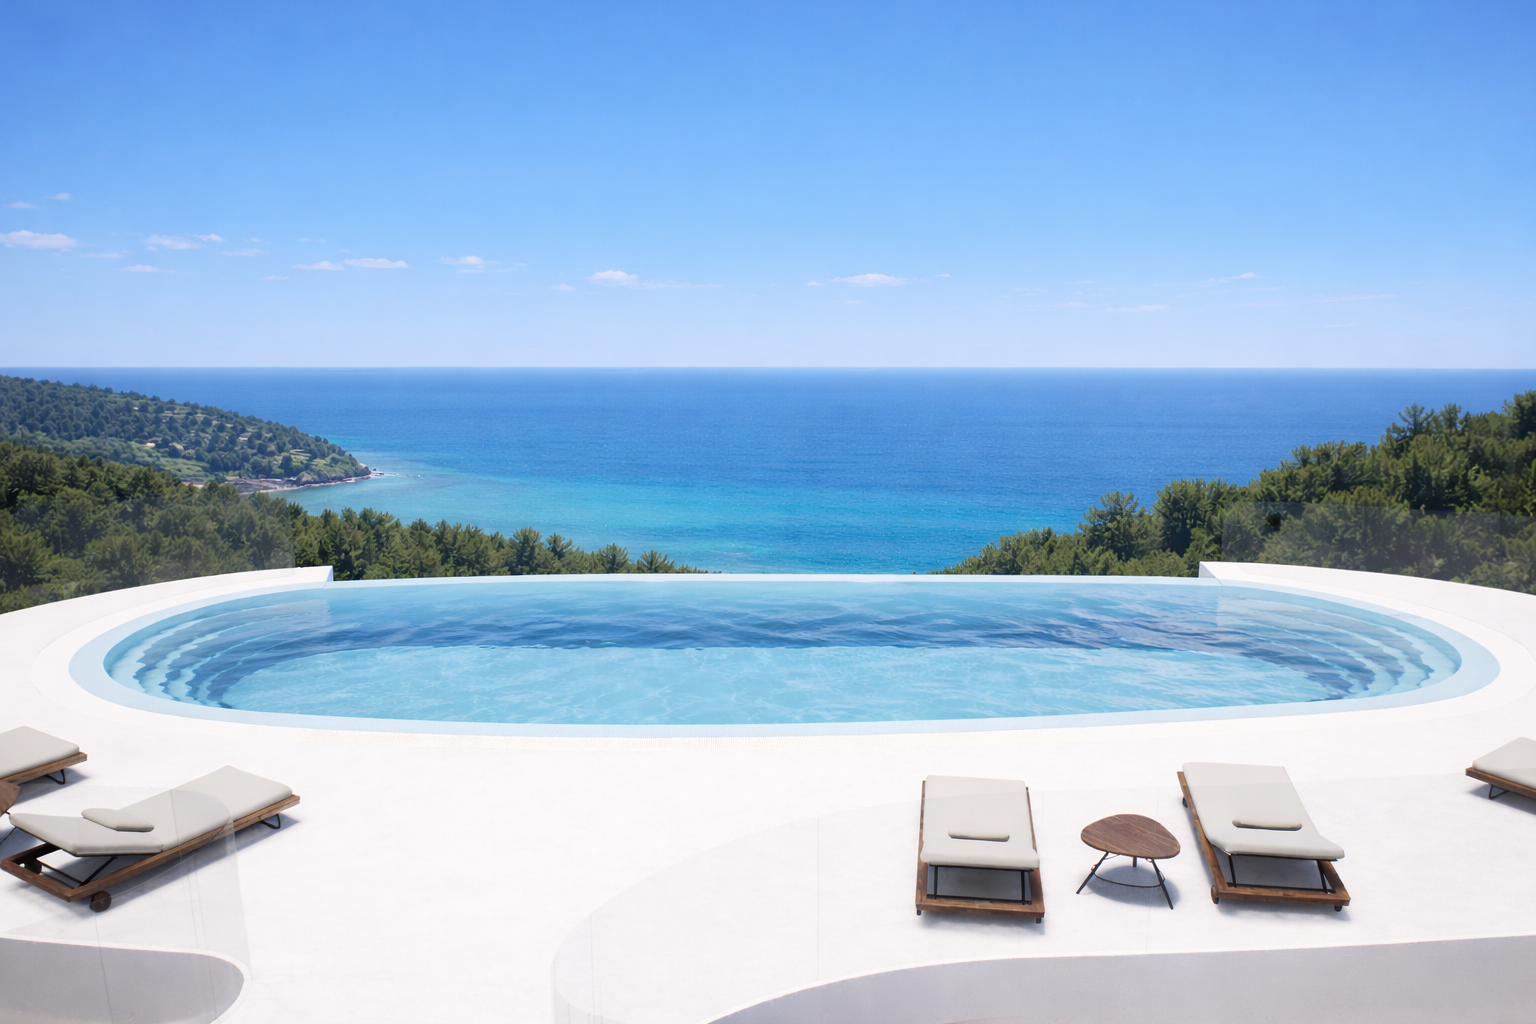
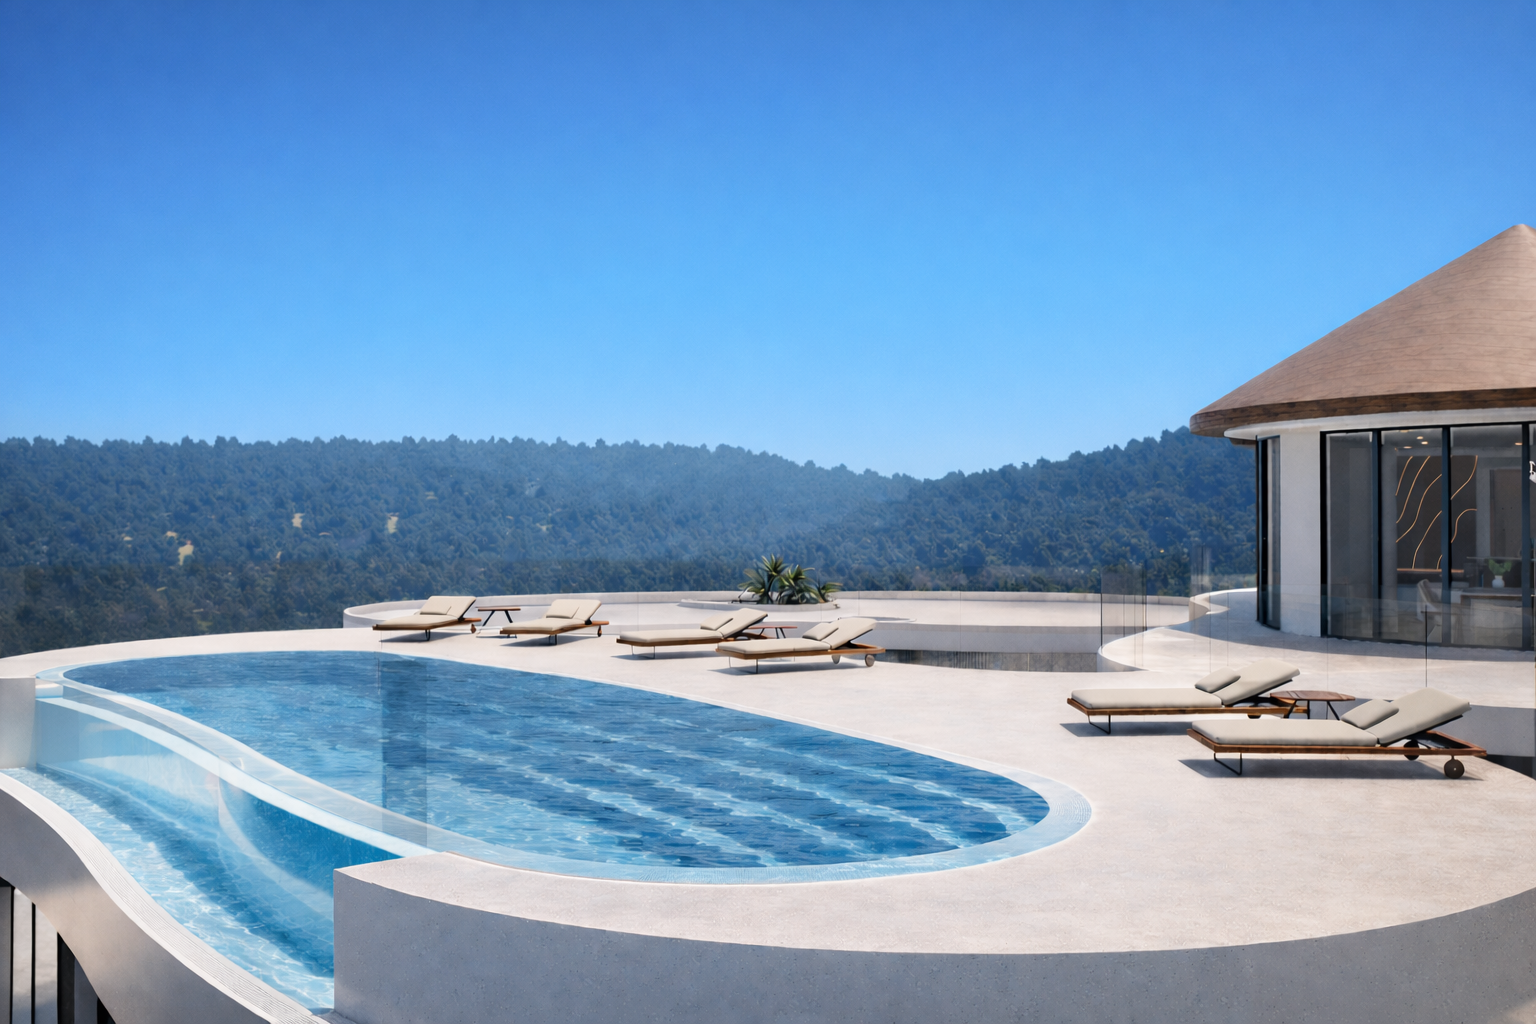
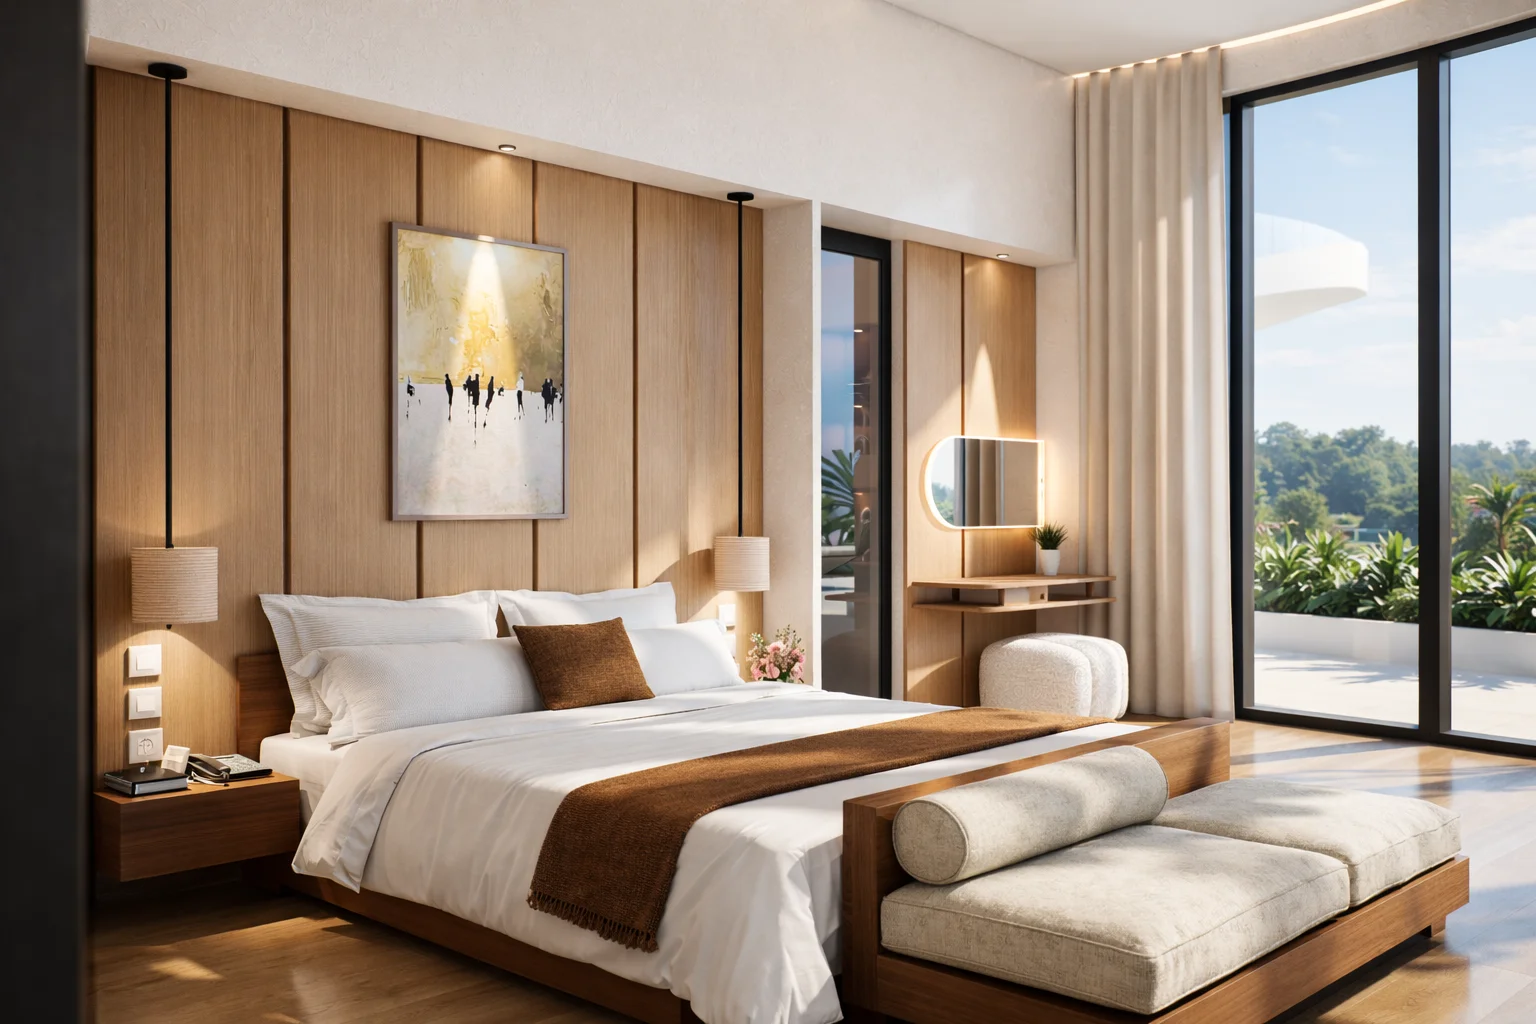
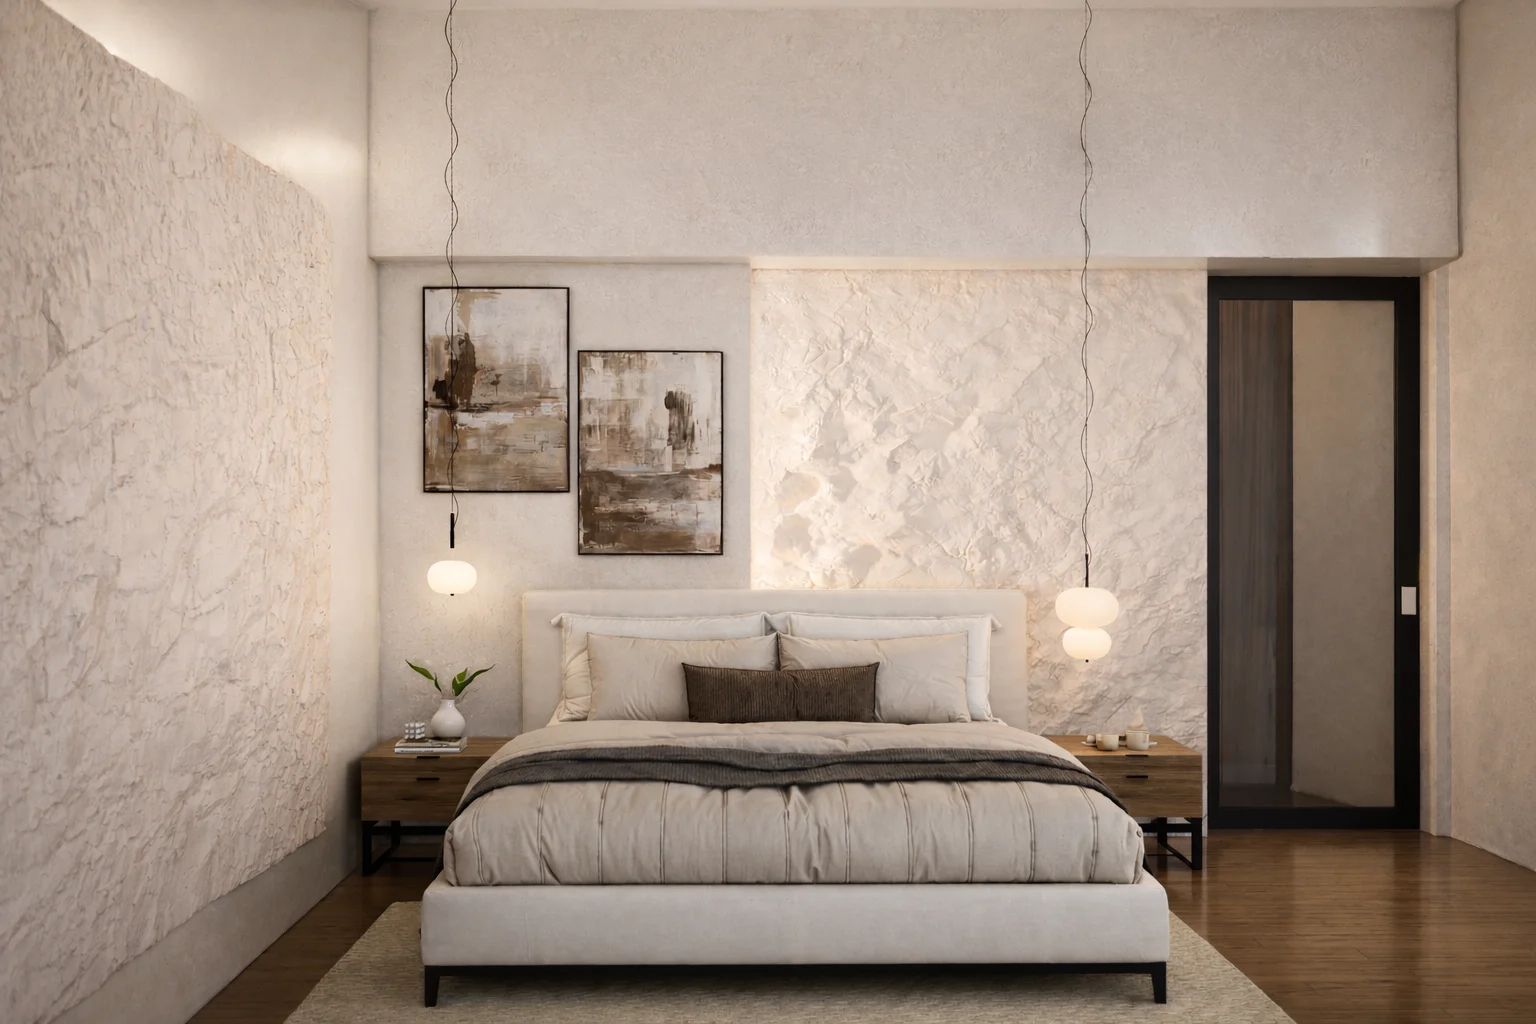
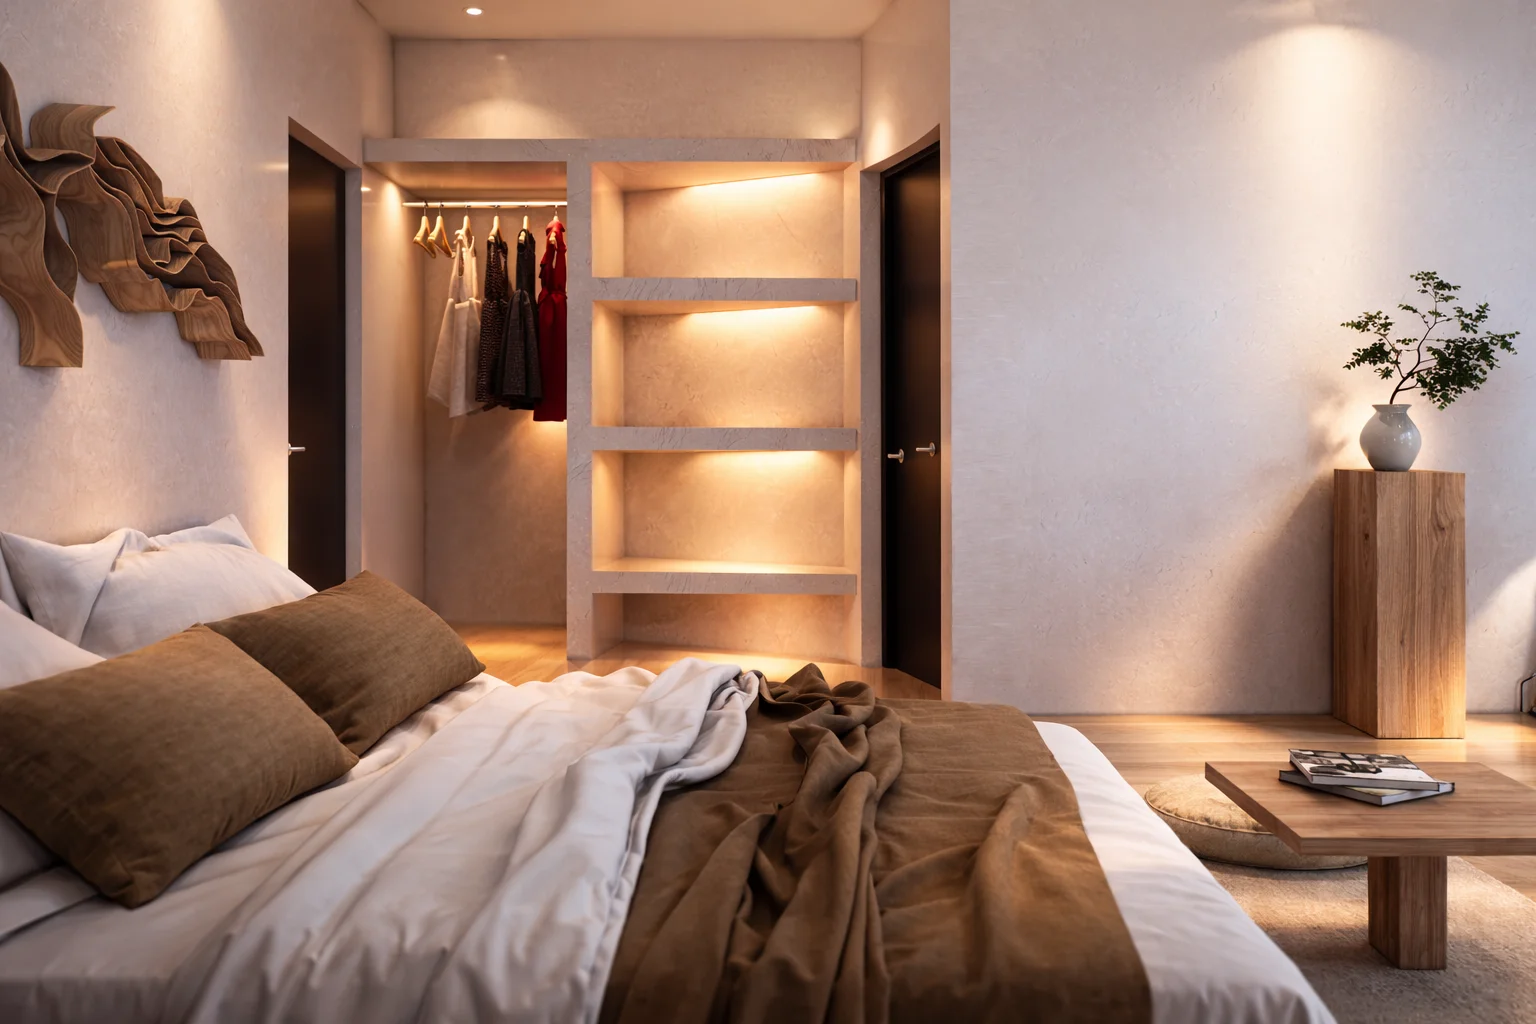
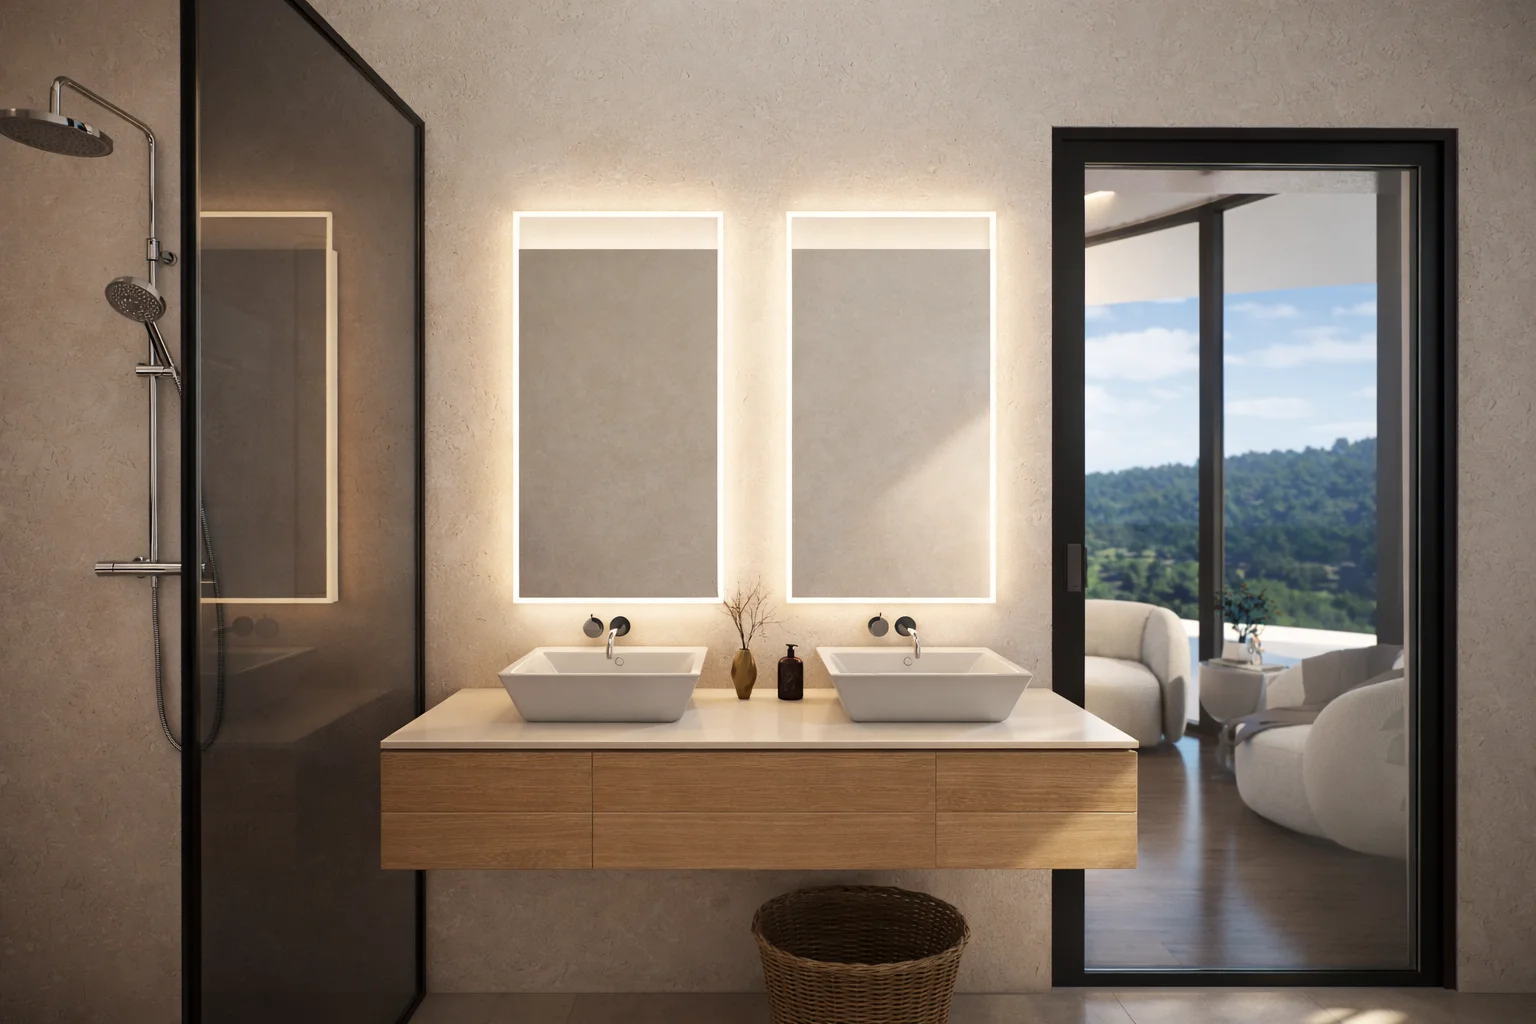
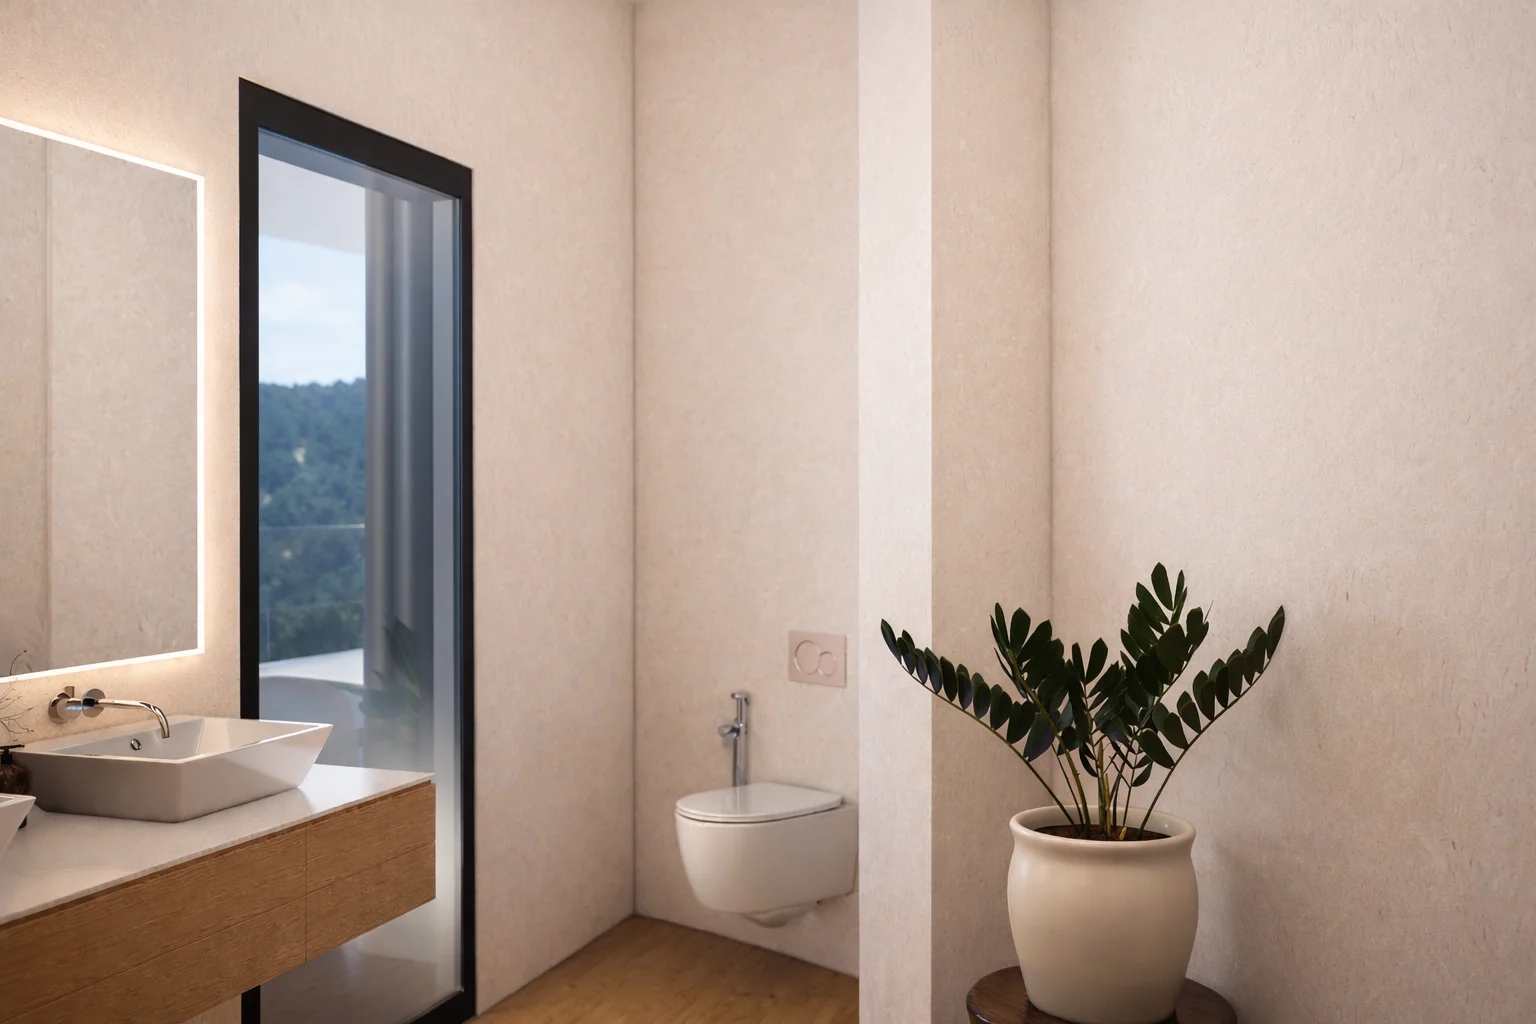
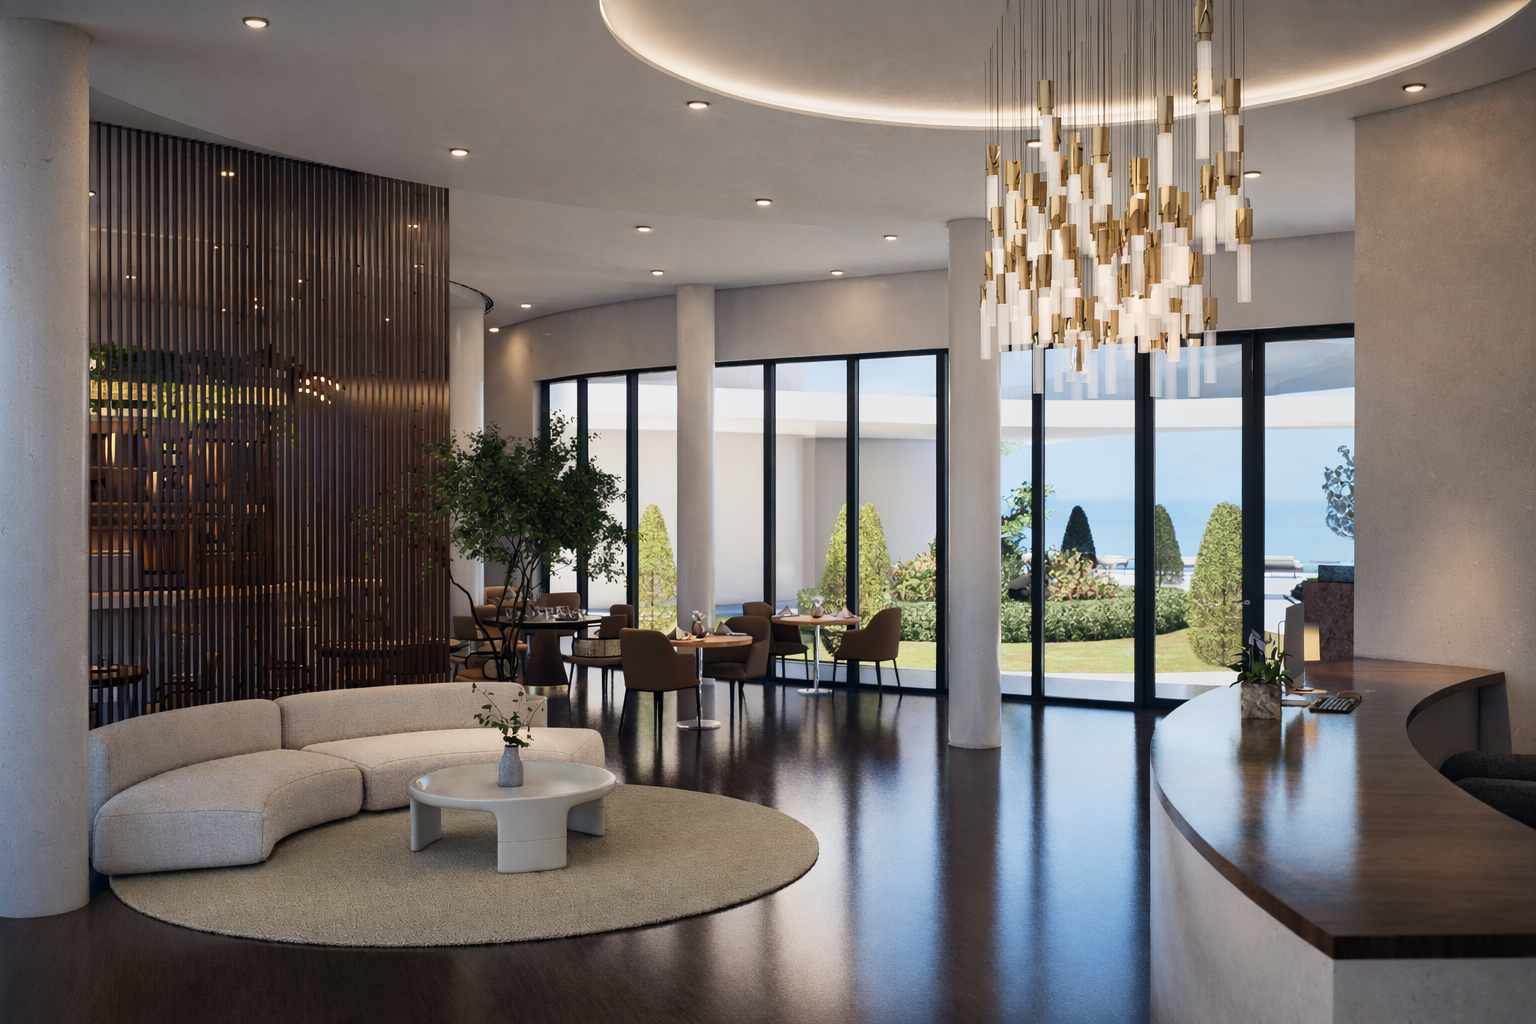
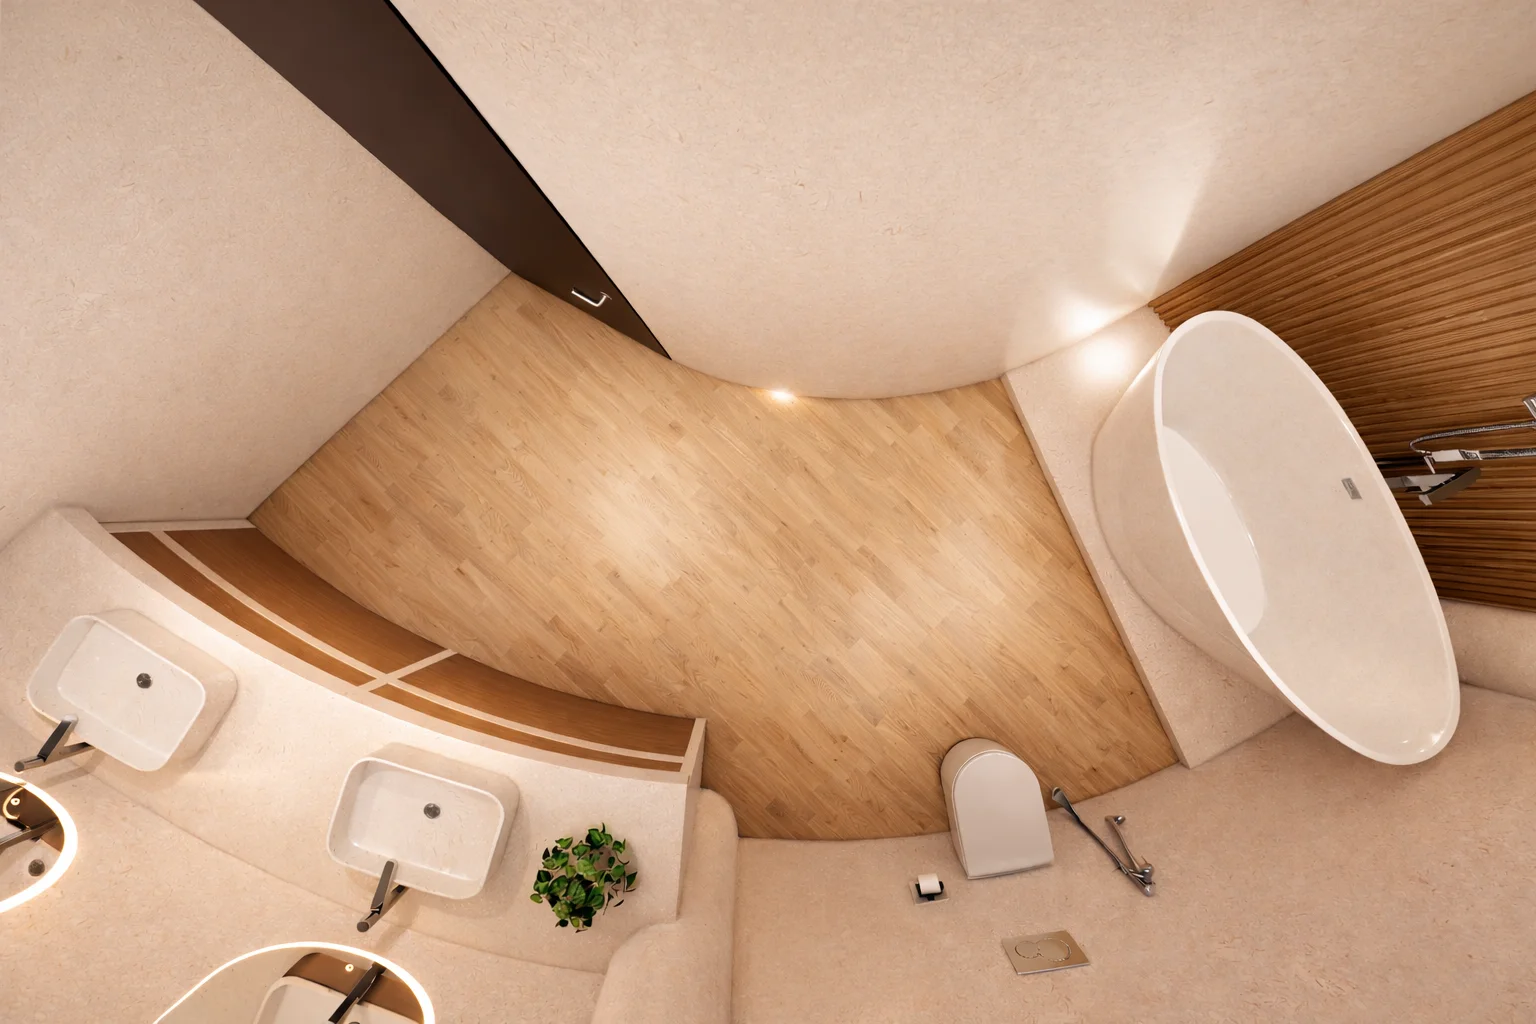
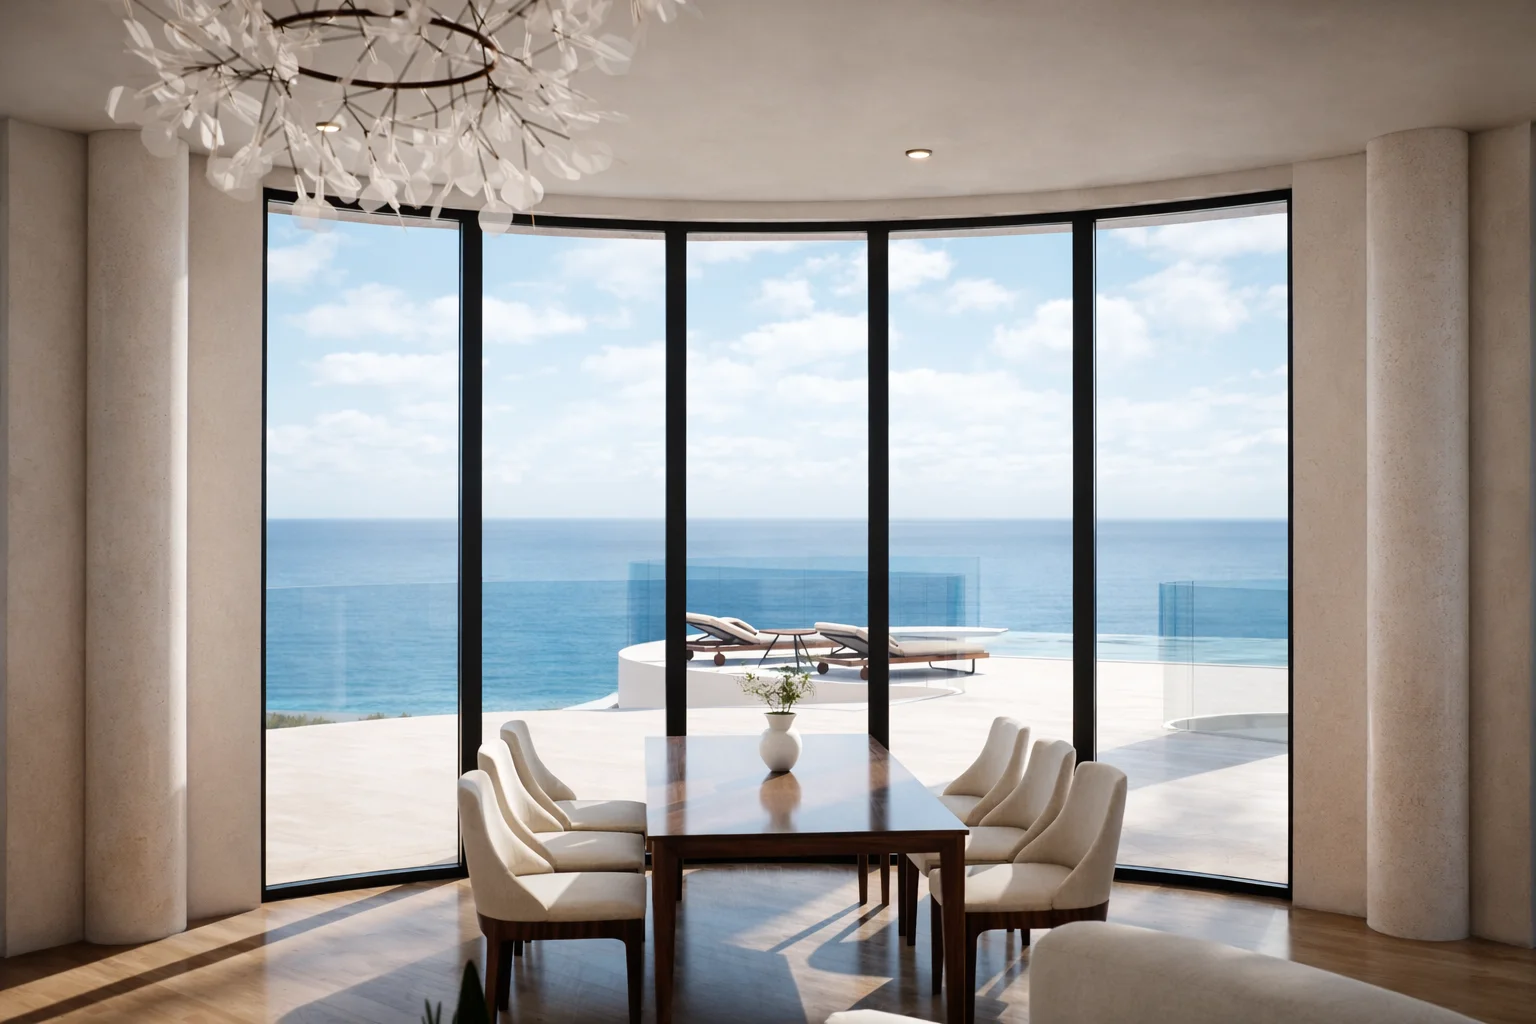
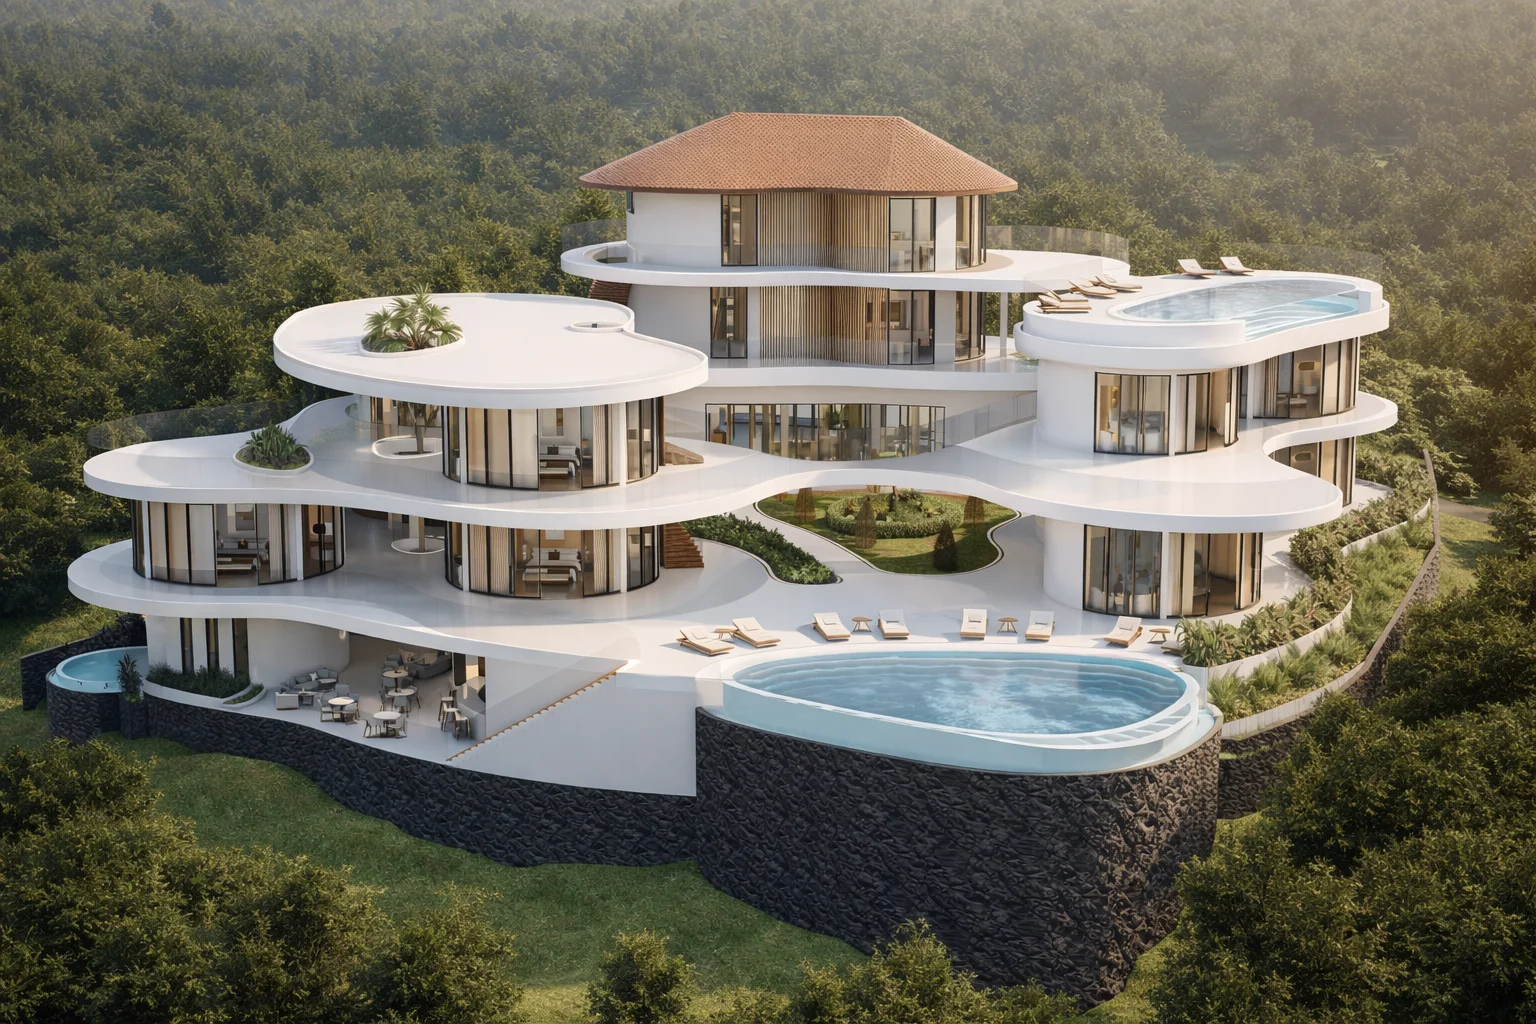
The Nusa Penida Cliffside project represents the pinnacle of eco-luxury architecture and high-end hospitality. Set upon a 5,000 sqm oceanfront estate with direct sea access, the resort masterfully integrates sustainable design with sophisticated living. Each of the 8 exclusive villas is envisioned as a private sanctuary, featuring bespoke interior design, private pools, and a seamless indoor-outdoor flow that redefines the luxury island experience.
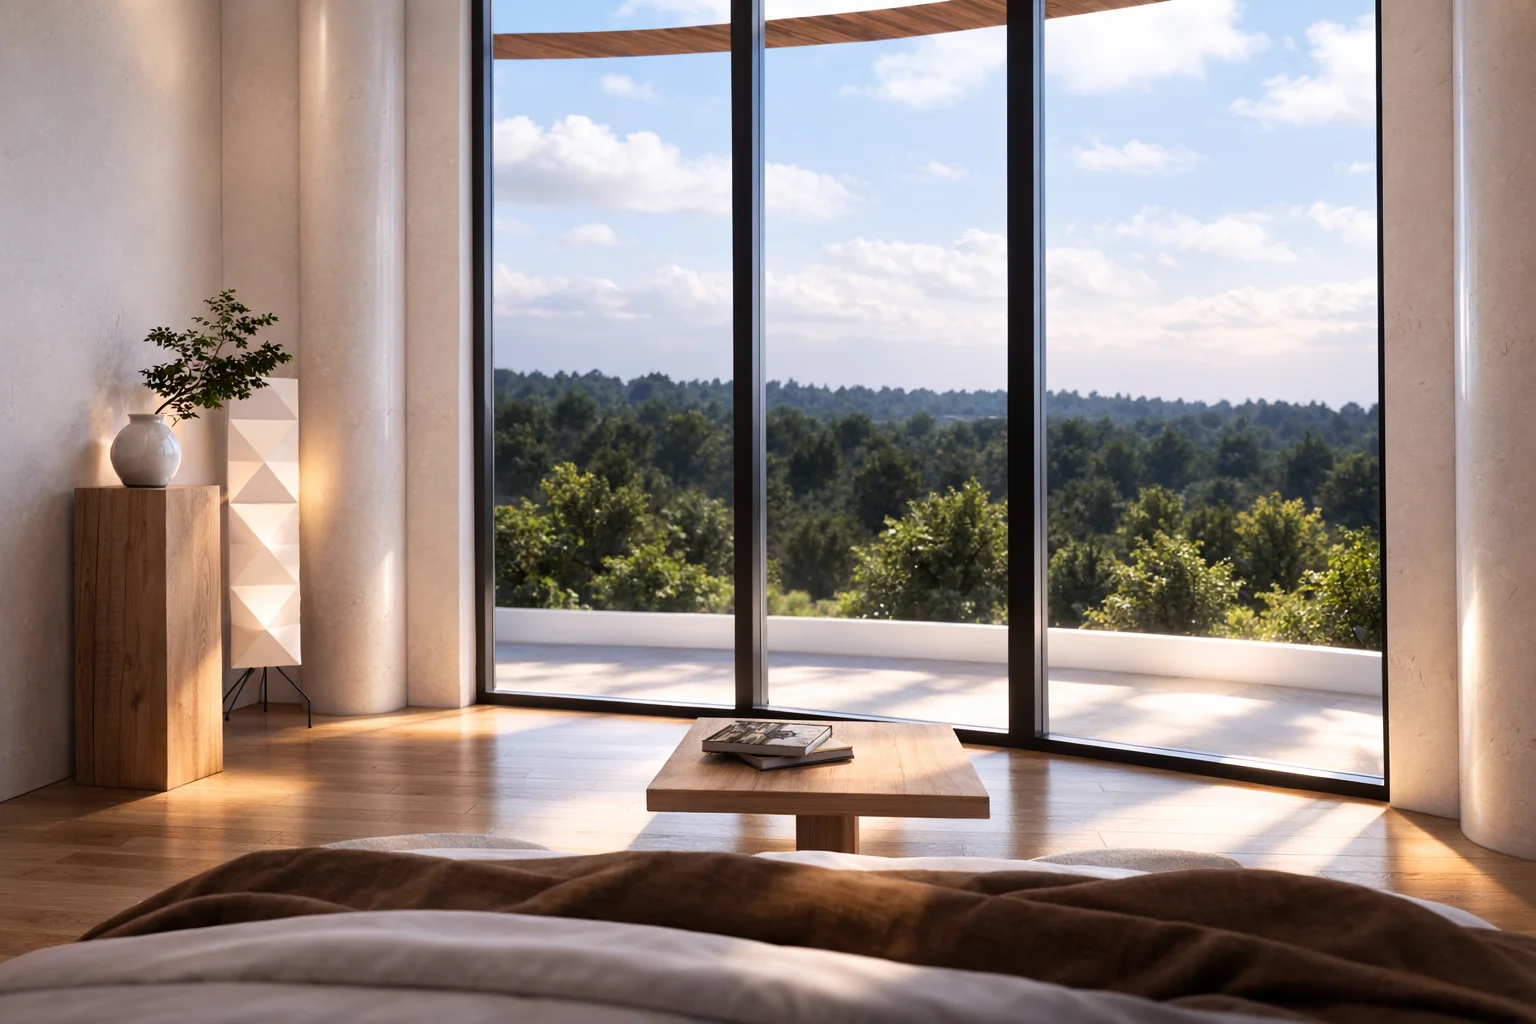
An exclusive boutique resort destination on the legendary island of Nusa Penida, featuring 8 ultra-luxury villas with breathtaking, infinite ocean views. This premier architectural development offers the ultimate luxury villa experience near Bali, combining sophisticated design with unparalleled coastal vistas.
€3,680k
€50k
22.70%
永久业权
探索推动度假村收入的高端别墅与套房组合,其日均房价(ADR)根据独特性进行调整。
Rather than a simple average, the resort average daily rate (ADR) of €411.25 is calculated dynamically using a weighted average based on inventory mix. This yields highly precise, risk-adjusted yield pro-formas.
In luxury boutique operations, rooms drive only a portion of total yield. Pro-formas integrate additional revenue streams calculated as ratios of room revenues:
Nusa Penida: The emerging epicenter of eco-luxury tourism in Bali, witnessing record-breaking growth in the premium sector—a premier destination for sustainable architecture and high-end luxury villa development.


| Metric | Value |
|---|---|
| Land Cost | €736.000 (est.) |
| Construction Cost | €2.208.000 (est.) |
| Development Cost | €736.000 (est.) |
| Projected Exit Value | €5.520.000 (est.) |
| ROI | 22.70% |
| Timeline | 18 几个月 |
Data-driven strategic analysis: transitioning from transient daily visitors to high-yield, extended luxury stays.
The project is strategically situated within the ultra-luxury hospitality segment of Nusa Penida, leveraging a prime cliffside location that ensures absolute privacy and panoramic ocean vistas. The signature Domo Resort architecture is not merely an aesthetic statement, but a calculated investment move designed to command a premium Average Daily Rate (ADR) significantly above the regional market average.
We implement a lean operational management model specifically engineered to minimize overhead and maximize EBITDA margins. The resort’s low-density master plan facilitates an elite guest-to-staff ratio, delivering a bespoke, high-end service experience without the prohibitive fixed costs typical of conventional large-scale hotel developments.
Nusa Penida has undergone a massive transformation, growing from 200,000 arrivals in 2017 to over 1.1 million in 2024. The market is currently at a critical inflection point: shifting from "day-trip" excursions to extended luxury stays. Institutional investors and the burgeoning "slow-travel" demographic are increasingly seeking exclusive, low-density environments. By securing a position in this privileged cliffside enclave, Antonio Rutilio Design captures the early maturity phase of the island’s luxury boom, offering projected capital appreciation that outpaces saturated markets like Canggu.
通过调整下面的投资金额来模拟您的回报。
27.1%
€1.9M
44.0%
5 年
年份 7
€4.0M
€27.100
基于内部收益率 27.1%The project is designed as a low-density, high-margin boutique resort, optimizing both pricing and operational efficiency. Revenue is driven by premium positioning, ocean-view units, and strong demand for experiential hospitality in Nusa Penida.
Operating costs are controlled through a lean operational model and selective outsourcing of non-core services, ensuring maximum conversion to EBITDA.
>Nusa Penida is one of Bali’s fastest-growing destinations, with increasing demand for high-end, design-driven accommodations.
I'm sorry, but there is no content provided to localize. Please provide the text or content you would like to have localized for the English market.
The project targets a stabilized EBITDA margin of approximately 40–45%, generating consistent annual cash flow. Investors benefit from:
The project adopts a conservative financial approach with realistic occupancy and pricing assumptions.
降低运营复杂性和员工开销。
支持优质 ADR 的建筑风格。
住宿、餐饮和健康收入来源。
发起人直接参与开发和控制。
Disclaimer: This material is for informational purposes only and does not constitute an offer or solicitation to invest. Details are provided upon request for qualified partners.
该图表代表了总投资的战略分布。优先考虑建筑、土地权利和建设阶段,以确保资产寿命和优质定位。
| 类别 | 投资项目 | 数量 |
|---|---|---|
| 征地 | Freehold Acquisition | €720.000 |
| 建造 | 主体结构与屋顶 | €1.500.000 |
| 家具及室内装饰 | 精英级家具、装置及设备(FF&E)方案 | €450.000 |
| 其他 | 安全储备金 | €290.000 |
| 设计与建筑 | 建筑与技术设计 | €300.000 |
| 家具及室内装饰 | 照明与装饰 | €80.000 |
| 家具及室内装饰 | 设备(空调、系统) | €120.000 |
| 项目管理 | 项目管理 | €70.000 |
| 设计与建筑 | 工程顾问 | €50.000 |
| 许可与法律 | 建筑许可与执照 | €60.000 |
| 许可与法律 | 法律与公司设立 | €15.000 |
| 其他 | 员工培训与招聘 | €25.000 |
| 预计总资本 | €3.680.000 | |
这些数据代表了该地点和资产类别的机构基准。情景模式通过改变这些变量来模拟风险。
项目生命周期内产生的总收入。
所有成本和投资回收后剩余的净资本。
绩效运作不包括非现金项目和税收。
归属于您的特定投资的净利润份额。
在稳定阶段之前实现全额资本回收。该模型展示了平衡的风险收益特征,具有强大的现金流产生能力和明确的资本回收时间表。
| 年份 | 预计入住人数 | 总收入 | 营业利润(EBITDA) | 净现金流量 |
|---|---|---|---|---|
| Year 1 | 55% | €1.212.028 | €387.849 | €318.036 |
| Year 2 | 65% | €1.475.369 | €531.133 | €435.529 |
| Year 3 | 75% | €1.751.932 | €700.773 | €574.634 |
| Year 4 | 77% | €1.849.555 | €776.813 | €636.987 |
| Year 5 | 75% | €1.851.097 | €814.483 | €667.876 |
| Year 6 | 75% | €1.900.680 | €836.299 | €685.766 |
| Year 7 | 75% | €1.950.263 | €858.116 | €703.655 |
| Year 8 | 75% | €1.999.846 | €879.932 | €721.545 |
| Year 9 | 75% | €2.049.429 | €901.749 | €739.434 |
| Year 10 | 75% | €2.099.012 | €923.565 | €757.324 |
| Year 11 | 75% | €2.161.983 | €951.272 | €780.043 |
| Year 12 | 75% | €2.226.842 | €979.811 | €803.445 |
| Year 13 | 75% | €2.293.647 | €1.009.205 | €827.548 |
| Year 14 | 75% | €2.362.457 | €1.039.481 | €852.374 |
| Year 15 | 75% | €2.433.331 | €1.070.665 | €877.946 |
| Year 16 | 75% | €2.506.331 | €1.102.785 | €904.284 |
| Year 17 | 75% | €2.581.520 | €1.135.869 | €931.413 |
| Year 18 | 75% | €2.658.966 | €1.169.945 | €959.355 |
| Year 19 | 75% | €2.738.735 | €1.205.043 | €988.136 |
| Year 20 | 75% | €2.820.897 | €1.241.195 | €1.017.780 |
| Year 21 | 75% | €2.905.524 | €1.278.431 | €1.048.313 |
| Year 22 | 75% | €2.992.690 | €1.316.783 | €1.079.762 |
| Year 23 | 75% | €3.082.470 | €1.356.287 | €1.112.155 |
| Year 24 | 75% | €3.174.945 | €1.396.976 | €1.145.520 |
| Year 25 | 75% | €3.270.193 | €1.438.885 | €1.179.886 |
| Year 26 | 75% | €3.368.299 | €1.482.051 | €1.215.282 |
| Year 27 | 75% | €3.469.348 | €1.526.513 | €1.251.741 |
| Year 28 | 75% | €3.573.428 | €1.572.308 | €1.289.293 |
| Year 29 | 75% | €3.680.631 | €1.619.478 | €1.327.972 |
| Year 30 | 75% | €3.791.050 | €1.668.062 | €1.367.811 |
| Year 31 | 75% | €3.904.781 | €1.718.104 | €1.408.845 |
| Year 32 | 75% | €4.021.925 | €1.769.647 | €1.451.110 |
| Year 33 | 75% | €4.142.582 | €1.822.736 | €1.494.644 |
| Year 34 | 75% | €4.266.860 | €1.877.418 | €1.539.483 |
| Year 35 | 75% | €4.394.866 | €1.933.741 | €1.585.668 |
| Year 36 | 75% | €4.526.712 | €1.991.753 | €1.633.238 |
| Year 37 | 75% | €4.662.513 | €2.051.506 | €1.682.235 |
| Year 38 | 75% | €4.802.388 | €2.113.051 | €1.732.702 |
| Year 39 | 75% | €4.946.460 | €2.176.442 | €1.784.683 |
| Year 40 | 75% | €5.094.854 | €2.241.736 | €1.838.223 |
| Year 41 | 75% | €5.247.700 | €2.308.988 | €1.893.370 |
| Year 42 | 75% | €5.405.130 | €2.378.257 | €1.950.171 |
| Year 43 | 75% | €5.567.284 | €2.449.605 | €2.008.676 |
| Year 44 | 75% | €5.734.303 | €2.523.093 | €2.068.936 |
| Year 45 | 75% | €5.906.332 | €2.598.786 | €2.131.005 |
| Year 46 | 75% | €6.083.522 | €2.676.750 | €2.194.935 |
| Year 47 | 75% | €6.266.028 | €2.757.052 | €2.260.783 |
| Year 48 | 75% | €6.454.008 | €2.839.764 | €2.328.606 |
| Year 49 | 75% | €6.647.629 | €2.924.957 | €2.398.464 |
| Year 50 | 75% | €6.847.058 | €3.012.705 | €2.470.418 |
| Year 51 | 75% | €7.052.469 | €3.103.087 | €2.544.531 |
| Year 52 | 75% | €7.264.043 | €3.196.179 | €2.620.867 |
| Year 53 | 75% | €7.481.965 | €3.292.064 | €2.699.493 |
| Year 54 | 75% | €7.706.424 | €3.390.826 | €2.780.478 |
| Year 55 | 75% | €7.937.616 | €3.492.551 | €2.863.892 |
| Year 56 | 75% | €8.175.745 | €3.597.328 | €2.949.809 |
| Year 57 | 75% | €8.421.017 | €3.705.248 | €3.038.303 |
| Year 58 | 75% | €8.673.648 | €3.816.405 | €3.129.452 |
| Year 59 | 75% | €8.933.857 | €3.930.897 | €3.223.336 |
| Year 60 | 75% | €9.201.873 | €4.048.824 | €3.320.036 |
| Year 61 | 75% | €9.477.929 | €4.170.289 | €3.419.637 |
| Year 62 | 75% | €9.762.267 | €4.295.397 | €3.522.226 |
| Year 63 | 75% | €10.055.135 | €4.424.259 | €3.627.893 |
| Year 64 | 75% | €10.356.789 | €4.556.987 | €3.736.729 |
| Year 65 | 75% | €10.667.493 | €4.693.697 | €3.848.831 |
| Year 66 | 75% | €10.987.517 | €4.834.508 | €3.964.296 |
| Year 67 | 75% | €11.317.143 | €4.979.543 | €4.083.225 |
| Year 68 | 75% | €11.656.657 | €5.128.929 | €4.205.722 |
| Year 69 | 75% | €12.006.357 | €5.282.797 | €4.331.894 |
| Year 70 | 75% | €12.366.548 | €5.441.281 | €4.461.850 |
| Year 71 | 75% | €12.737.544 | €5.604.519 | €4.595.706 |
| Year 72 | 75% | €13.119.670 | €5.772.655 | €4.733.577 |
| Year 73 | 75% | €13.513.261 | €5.945.835 | €4.875.584 |
| Year 74 | 75% | €13.918.658 | €6.124.210 | €5.021.852 |
| Year 75 | 75% | €14.336.218 | €6.307.936 | €5.172.507 |
| Year 76 | 75% | €14.766.305 | €6.497.174 | €5.327.683 |
| Year 77 | 75% | €15.209.294 | €6.692.089 | €5.487.513 |
| Year 78 | 75% | €15.665.573 | €6.892.852 | €5.652.139 |
| Year 79 | 75% | €16.135.540 | €7.099.637 | €5.821.703 |
| Year 80 | 75% | €16.619.606 | €7.312.627 | €5.996.354 |
| Year 81 | 75% | €17.118.194 | €7.532.005 | €6.176.244 |
| Year 82 | 75% | €17.631.740 | €7.757.966 | €6.361.532 |
| Year 83 | 75% | €18.160.692 | €7.990.705 | €6.552.378 |
| Year 84 | 75% | €18.705.513 | €8.230.426 | €6.748.949 |
| Year 85 | 75% | €19.266.678 | €8.477.338 | €6.951.418 |
| Year 86 | 75% | €19.844.679 | €8.731.659 | €7.159.960 |
| Year 87 | 75% | €20.440.019 | €8.993.608 | €7.374.759 |
| Year 88 | 75% | €21.053.220 | €9.263.417 | €7.596.002 |
| Year 89 | 75% | €21.684.816 | €9.541.319 | €7.823.882 |
| Year 90 | 75% | €22.335.361 | €9.827.559 | €8.058.598 |
| Year 91 | 75% | €23.005.421 | €10.122.385 | €8.300.356 |
| Year 92 | 75% | €23.695.584 | €10.426.057 | €8.549.367 |
| Year 93 | 75% | €24.406.452 | €10.738.839 | €8.805.848 |
| Year 94 | 75% | €25.138.645 | €11.061.004 | €9.070.023 |
| Year 95 | 75% | €25.892.805 | €11.392.834 | €9.342.124 |
| Year 96 | 75% | €26.669.589 | €11.734.619 | €9.622.388 |
| Year 97 | 75% | €27.469.676 | €12.086.658 | €9.911.059 |
| Year 98 | 75% | €28.293.767 | €12.449.257 | €10.208.391 |
| Year 99 | 75% | €29.142.580 | €12.822.735 | €10.514.643 |
| Year 100 | 75% | €30.016.857 | €13.207.417 | €10.830.082 |
+3.50% 年度
+2.50% 年度
11.4% 目标
| ADR \ OCC | 65% | 70% | 75% | 80% | 85% |
|---|---|---|---|---|---|
| €200 | 21.3% | 22.6% | 23.9% | 25.2% | 26.5% |
| €225 | 23.4% | 24.9% | 26.3% | 27.8% | 29.2% |
| €250 | 25.5% | 27.1% | 28.7% | 30.4% | 32.0% |
| €275 | 27.6% | 29.4% | 31.2% | 33.0% | 34.7% |
| €300 | 29.7% | 31.7% | 33.6% | 35.5% | 37.5% |
Legal Disclaimer: This sensitivity analysis is based on historical market performance and projected operational standards in Nusa Penida. Actual results may vary depending on global tourism trends, local regulations, and macroeconomic factors. This is not a guarantee of future returns.
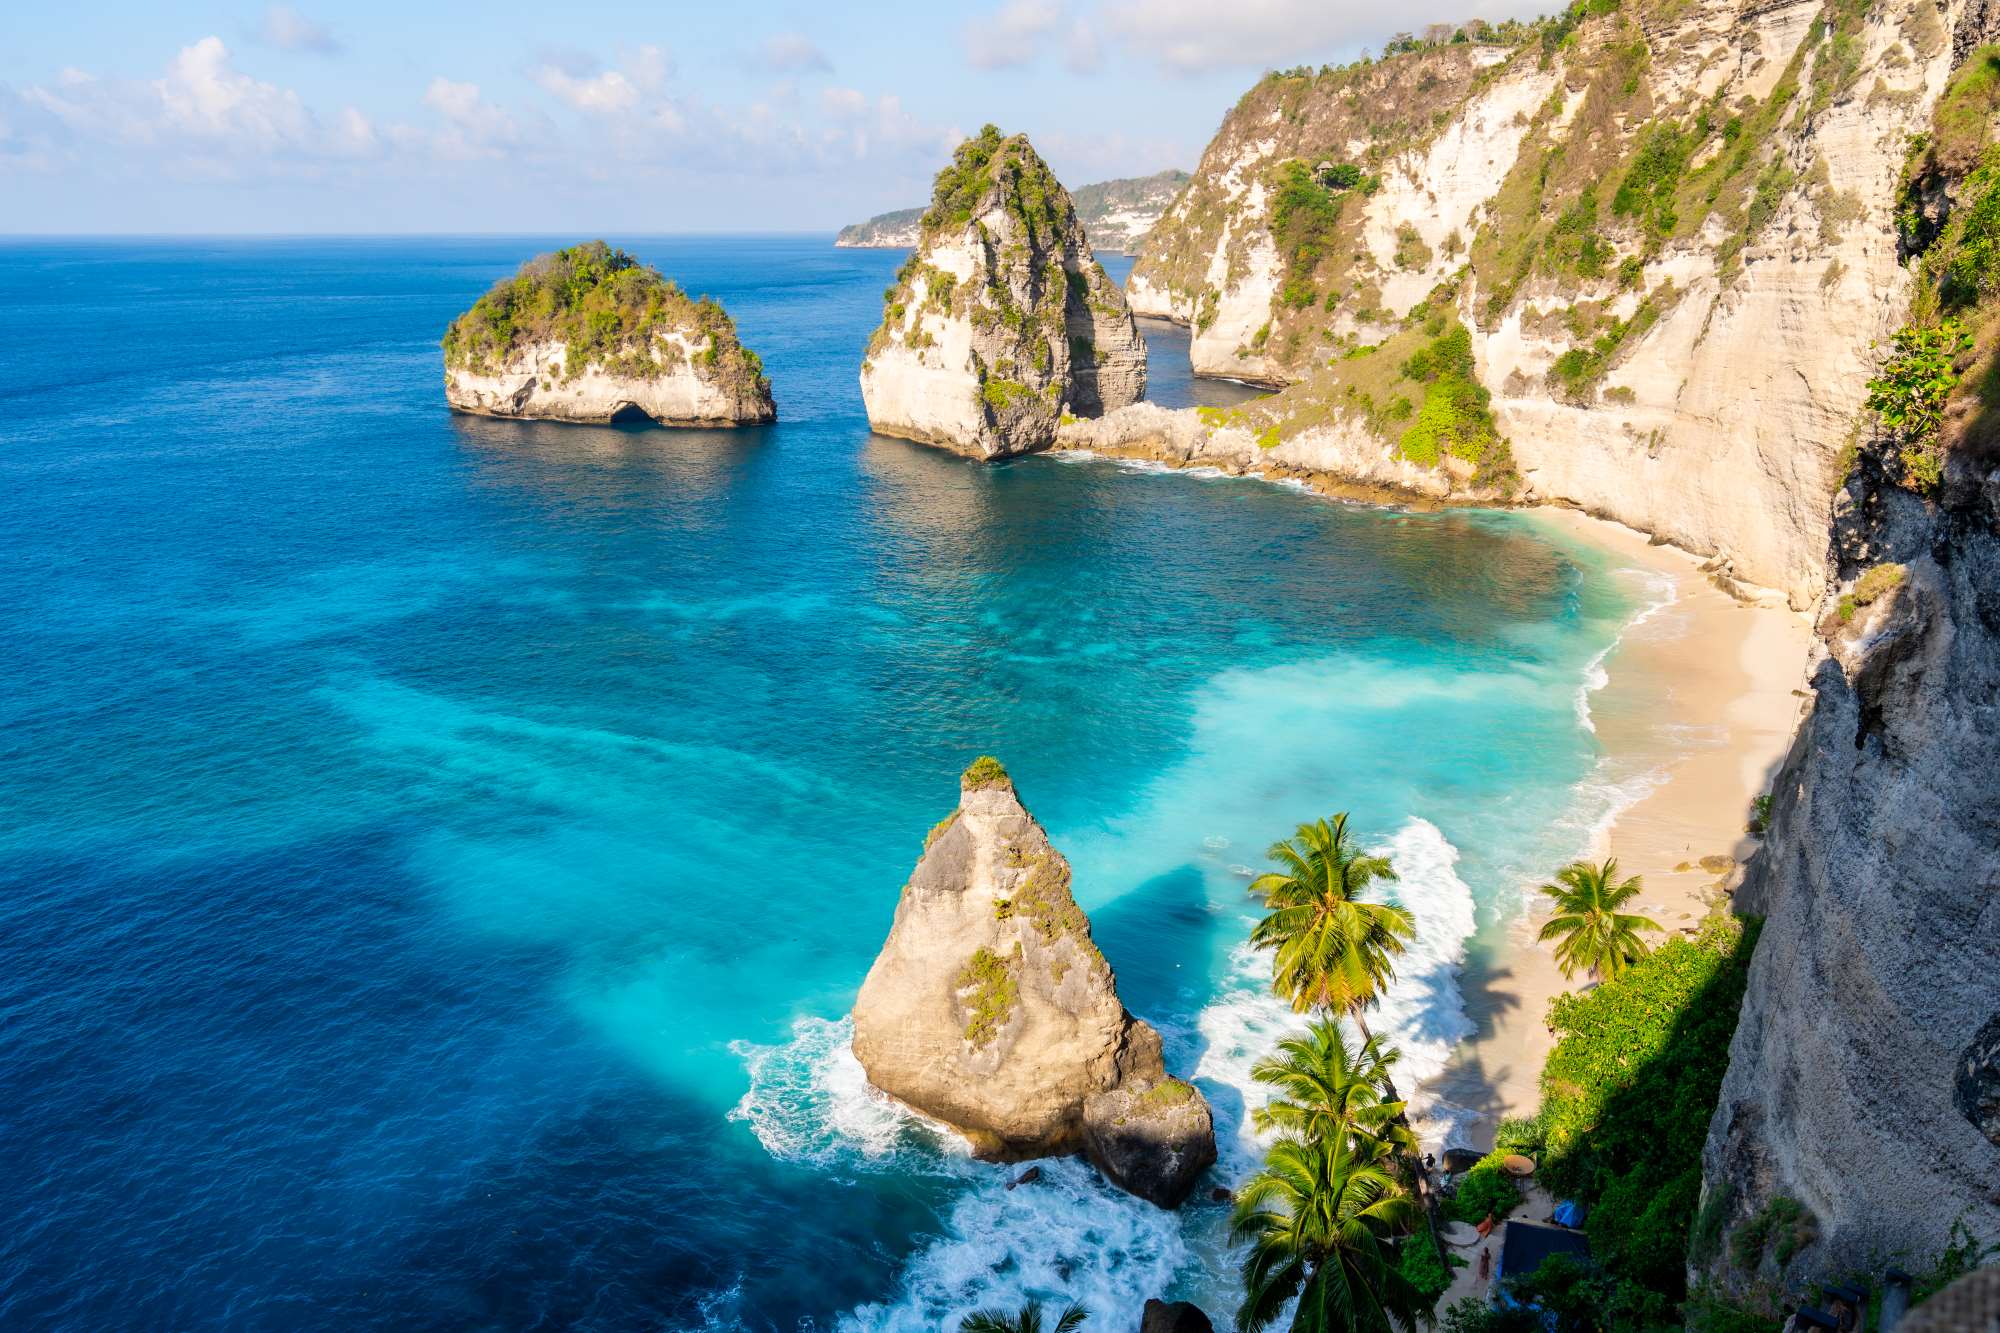
Unbelievable cliffside white sand beach on the eastern tip of Nusa Penida.

The famous T-Rex shaped cliff and pristine white sand beach below.
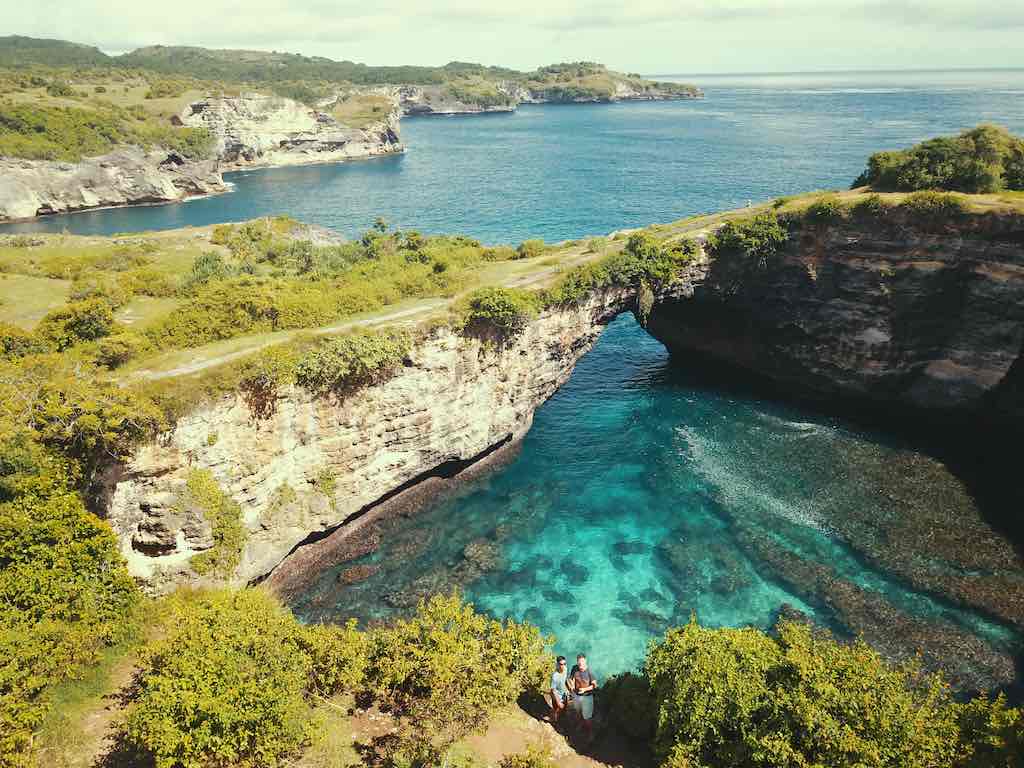
A scenic natural bridge arch over a turquoise sea cove.
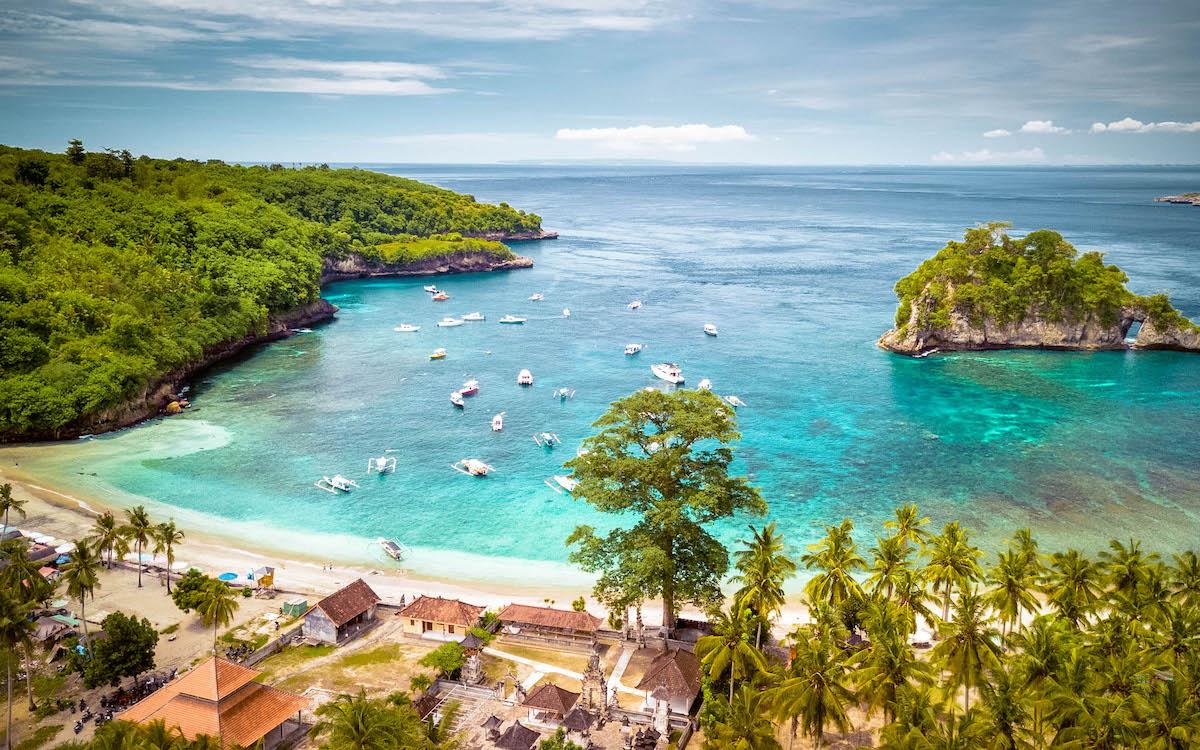
Famous palm-fringed beach offering spectacular Balinese sunsets and snorkeling.

Famous beachside bar known for live music, sunset views, and signature cocktails.

Popular day club featuring a large pool, relaxed atmosphere, and international DJ sets.
Premium beach club near Toyapakeh harbor with direct beach access and luxury daybeds.
Iconic sunset destination offering panoramic ocean views and private bamboo nests.